The current trajectory of Bitcoin (BTC) suggests that it is approaching significant milestones, prompting a wave of optimism among investors and analysts alike. As Bitcoin heads towards its peak potential, an array of technical formations and time-sensitive indicators are indicating bullish sentiment, which could lead to substantial price gains shortly.
Technical Signals Indicate Potential Bull Run for Bitcoin
In a recent update, crypto strategist Mia highlighted that Bitcoin has successfully breached a bullish pennant formation and completed a thorough retest, indicating a robust move towards achieving a new all-time high (ATH). Mia forecasts that the bullish pennant could direct Bitcoin’s price towards a remarkable target of $150,000.

For those new to these concepts, a bullish pennant is a continuation pattern that typically emerges following a swift ascent in price, followed by a brief period of consolidation between converging trend lines. When a price breakout occurs above this structure, it often signifies a continuation of bullish momentum.
Additionally, analyst CryptoKnight pointed out another favorable chart pattern: the inverse head and shoulders. They presented a detailed weekly chart of Bitcoin and emphasized, “This is not the moment to adopt a bearish stance on Bitcoin.”
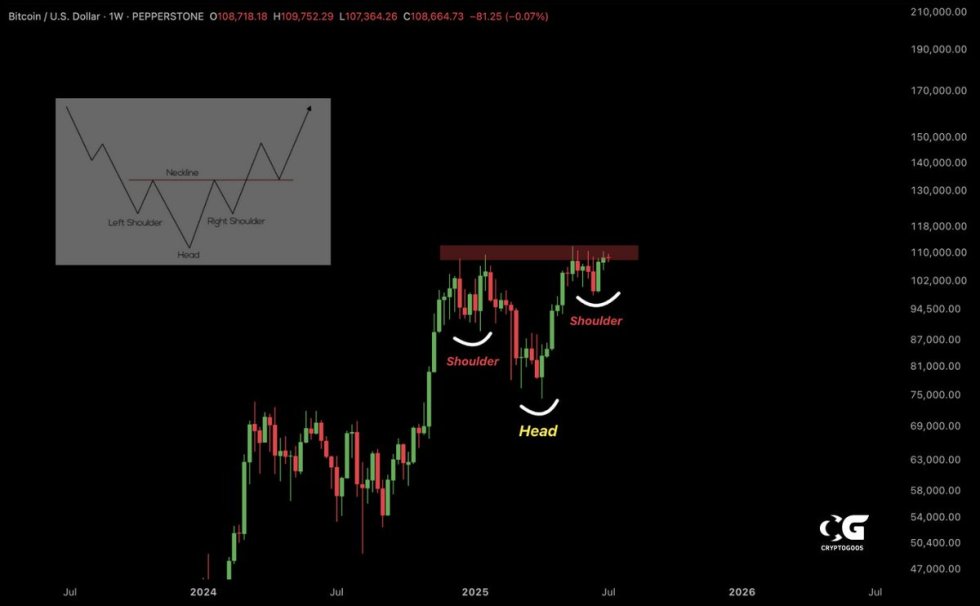
To elaborate, while a standard head and shoulders pattern typically signals impending bearish trends, its inverse counterpart indicates bullish potential. This pattern comprises three troughs, characterized by two lighter “shoulders” supporting a deeper “head,” culminating in a decisive breakout above the neckline.
Another trader, Alex Trends, likened the current Bitcoin cycle to the remarkable price surge seen between 2013 and 2017. They shared a chart illustrating that Bitcoin has executed an ABC pattern on the weekly scale, followed by an extensive period of consolidation and a favorable breakout retest.
Furthermore, well-known analyst DuoCrypto noted a historical relationship between Bitcoin’s market cycles and the U.S. election schedule. Historically, the cryptocurrency has reached peak prices roughly 53 weeks following a U.S. election.
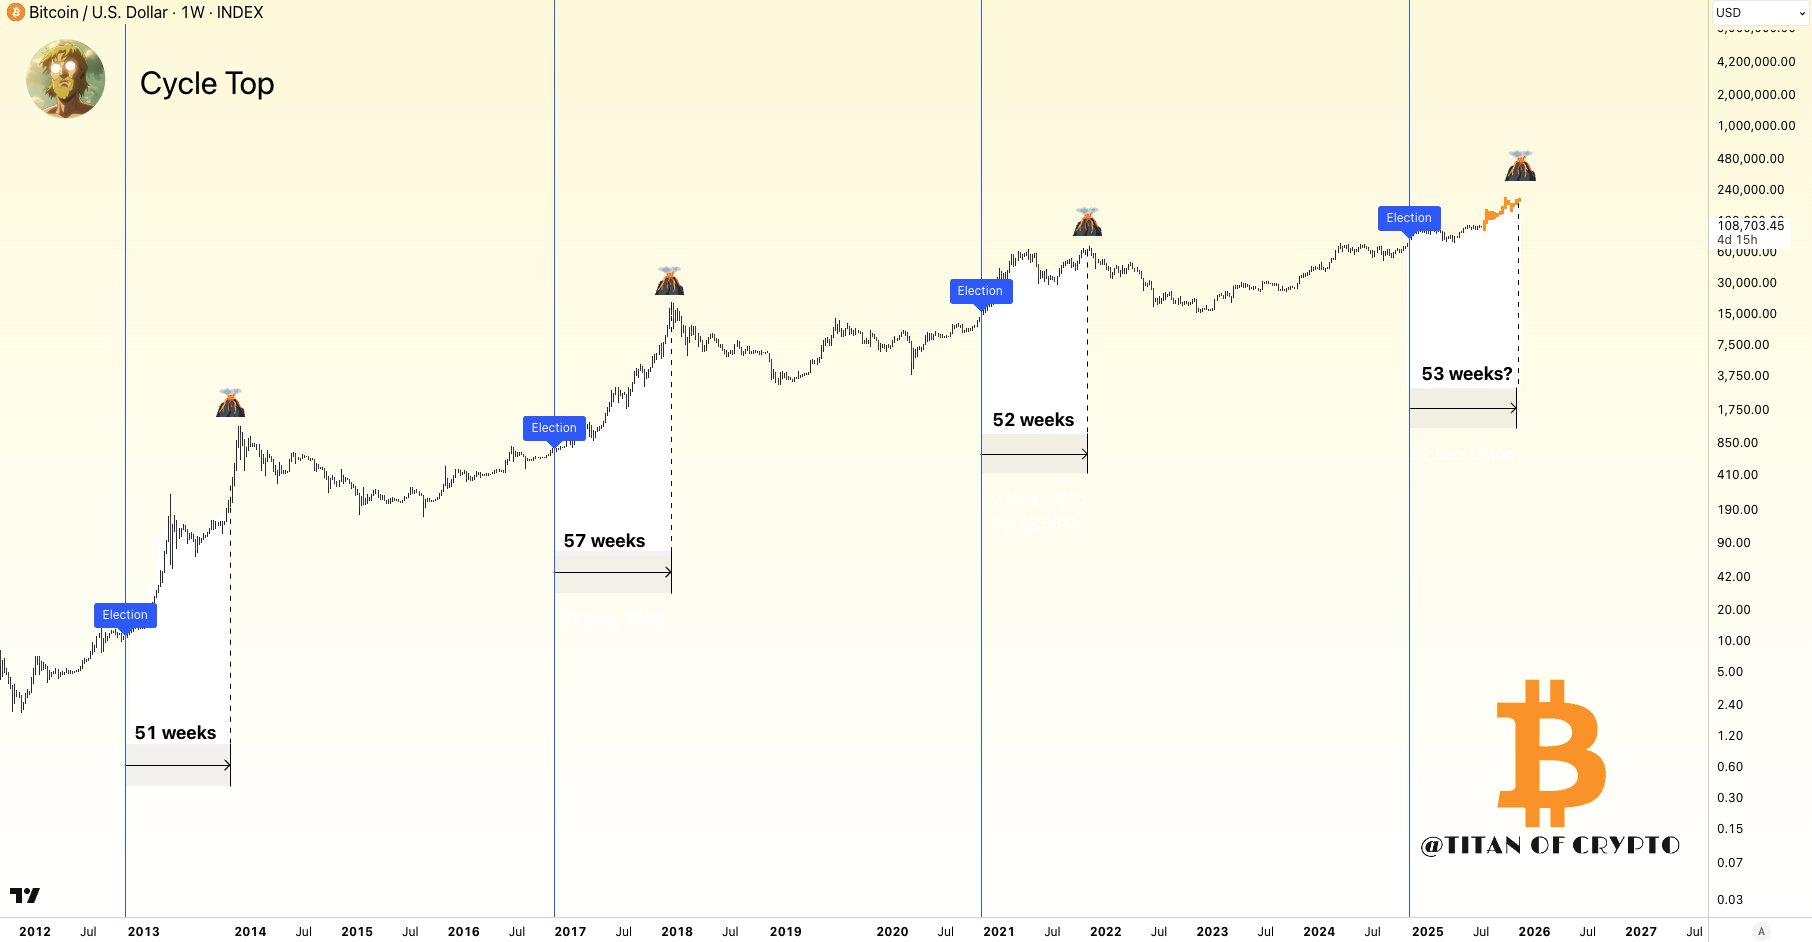
Considering that the last U.S. election occurred in November 2024, we are currently 36 weeks post-election. This suggests a possible peak for Bitcoin could materialize within the next 17 weeks, should historical precedents hold true.
Exchange Reserves Indicate Tightening Supply
On-chain metrics also contribute to the optimistic outlook. A recent analysis from CryptoQuant revealed that Bitcoin exchange reserves have dwindled to a low of 2.4 million BTC. This decline often hints at a tightening supply, which may foreshadow significant price movements as demand surges beyond the available supply.
These trends strongly resemble the dynamics observed during the bull cycle of 2020-2021, further fueling speculation about future price surges.
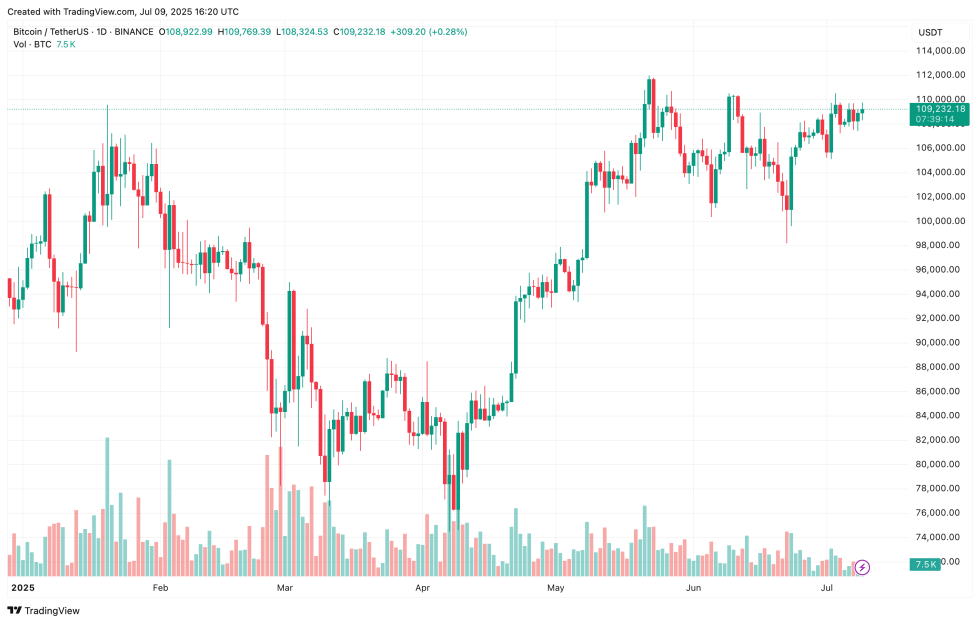
However, caution is warranted. The TD Sequential indicator has raised alerts about a potential correction that could drive Bitcoin’s price down towards the $40,000 mark. As it stands, Bitcoin is trading at approximately $109,232, reflecting a slight increase of 0.9% over the past day.