Bitcoin (BTC) continues to navigate the complex landscape of cryptocurrency markets as it seeks to assert itself above critical resistance thresholds this week. With traders keenly anticipating the upcoming Federal Reserve meeting, expectations are building regarding how regulatory shifts may impact digital assets as we move into the final months of the year. Recent trends indicate that market participants are bracing for fluctuations, as key economic indicators show signs of wearing down the previous aggressive monetary stance.
According to blockchain analyst CryptoGuru, emerging metrics have indicated a notable uptick in the BTC Stablecoin Reserve Ratio on major exchanges, interpreting this as a potential purchase signal. Historically, such flags have inspired upward price trajectories. This shift follows a turbulent period marked by the October 10th market corrections, which severely affected leveraged holdings across multiple platforms. As a result, the cascading impact created waves in both derivatives and spot markets, heightening investor anxiety but also creating new opportunities.

While some investors chose to play it safe by converting into stablecoins, others viewed the market downturn as a chance to accumulate Bitcoin. Evidence of this behavior can be seen in the changing statistics regarding reserves on exchanges. With Bitcoin hovering near pivotal resistance points, many traders are bracing themselves for what could be the next major market maneuver, heavily influenced by forthcoming macroeconomic policies and liquidity conditions.
BTC Indicators Point Towards Buying Opportunities
On-chain data compiled by CryptoGuru shows that recent trading patterns have led to significant changes in reserve dynamics on major exchanges, particularly in terms of stablecoin versus BTC allocations. This latest resurgence comes after the market’s recovery post-liquidation, signaling that the BTC/Stablecoin reserve ratio is currently exhibiting a buy signal for the third time in this cycle. Such signals have historically foreshadowed robust upward price movements for Bitcoin.
Historical data supports the validity of this signal. Notably, during a key point in January 2023, Bitcoin surged from $16,600 to a peak of $24,800. Similarly, a buy signal appeared in March 2023, triggering a monumental rise from $20,300 to $73,000, marking the onset of a bullish trend. The most recent indicator in March 2025 led to another bullish spike that saw Bitcoin climb from $78,600 to $123,500.
This recurring indication suggests not only a transient market shift but a more profound evolution in Binance’s reserves: a growing inventory of stablecoins poised to enter the market amid dwindling BTC reserves. This imbalance could lead to a supply shock, setting the stage for a substantial bullish reversal as purchasing demand may soon outweigh supply availability.
What adds an intriguing layer to this situation is the market context itself. Such buy signals generally surface during bear markets or after significant corrections, indicating an accumulation phase aimed at revitalizing market strength. Observing this trend while Bitcoin consolidates near pivotal support points hints that both large holders and institutional investors might already be gearing up for a definitive upward movement.
Resistance Challenges Ahead as BTC Aims for Recovery
At present, Bitcoin (BTC) is trading around $112,900, beginning to show encouraging signs of recovery after bouncing back from its 200-day moving average near $108,000. This price framework indicates that BTC is working diligently to regain bullish momentum, yet significant resistance at $117,500 presents a hurdle it must overcome to sustain this trajectory.
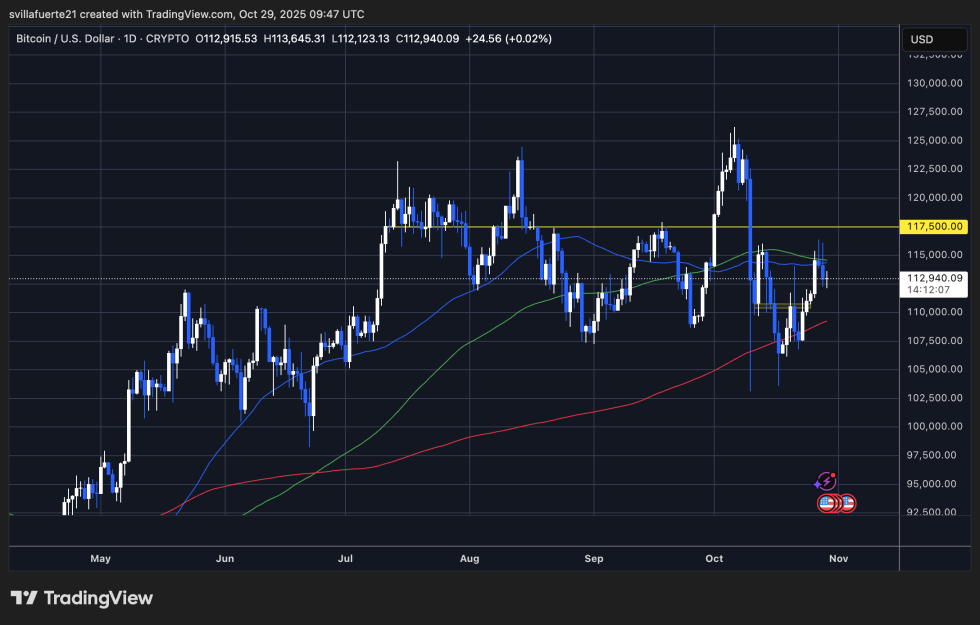
The intersection of the 50-day (blue) and 100-day (green) moving averages around the $114,000–$115,000 mark forms a strong resistance zone. A decisive break followed by a daily close above this range could validate the bullish trend and encourage movements toward the $120,000–$123,000 cluster, where past liquidity has accumulated.
Conversely, maintaining the 200-day MA remains crucial for sustaining overall trend strength. As long as Bitcoin trades above this level, the long-term outlook remains optimistic despite recent volatility. However, a breach below $108,000 could signify a slide toward the next major support at $102,500, where sellers may reemerge.
Traders are adopting a cautious stance in anticipation of the Federal Reserve meeting this Wednesday, weighing macroeconomic unpredictability against improving on-chain analytics. This ongoing consolidation phase could serve as a precursor to a significant breakout, likely to transpire once clear policy direction and liquidity cues are established.
Featured image sourced from ChatGPT. Chart data provided by TradingView.com.