As Bitcoin (BTC) maintains its position above the crucial $100,000 mark, a significant transformation is becoming evident among market participants. Particularly, the decline in exchange deposit activity reflects increasing trust in BTC as a dependable asset for value preservation.
Historical Drop in Bitcoin Deposit Address Activity
Recent insights from a CryptoQuant Quicktake post by the on-chain analyst Darkfost reveal a major change in the flow of BTC wallet addresses depositing into exchanges since the bullish market of 2021.

The provided analysis includes a compelling chart illustrating a consistent growth in the number of addresses sending BTC to exchanges from 2015 to 2021, culminating in an annual average of around 180,000 deposits.
However, that upward trend has sharply declined with no signs of resurgence. Currently, the 10-year average for BTC deposit addresses sits at approximately 90,000.
Short-term metrics further emphasize this downturn: the 30-day moving average (MA) is around 48,000, while daily deposits have plummeted to merely 37,000. This significant behavioral change among investors is linked to two main catalysts.
Firstly, the rise of BTC exchange-traded funds (ETFs) has shifted much demand away from traditional spot exchanges. ETFs offer exposure to Bitcoin’s price dynamics without the complications or risks associated with self-custody.
Secondly, participation from retail investors has been relatively low in this market cycle, contributing naturally to a decrease in active deposit addresses. The analyst pointed out:
There is a growing trend of investors, including companies, adopting a long-term perspective toward BTC, choosing to hold it as a form of savings or reserve rather than engaging in regular trading.
Are We On The Cusp of A New BTC High?
As the trend of BTC deposits to exchanges continues to decline, several indicators hint at the possibility of reaching a new all-time high (ATH). Recent analyses by crypto expert CryptoGoos indicate that short-term sellers may be running out of steam, suggesting a potential reduction in selling pressure shortly.
Moreover, the Bitcoin Rainbow Chart—a long-term pricing model designed to highlight periods of overvaluation and undervaluation—has recently emitted a ‘buy’ signal. Nevertheless, the overall market demand remains tepid.
Supporting factors also encompass improving macroeconomic conditions. An uptick in the global M2 money supply is anticipated to favor risk assets like Bitcoin. Speculation among some experts has BTC prices soaring to around $150,000 as liquidity conditions tighten.
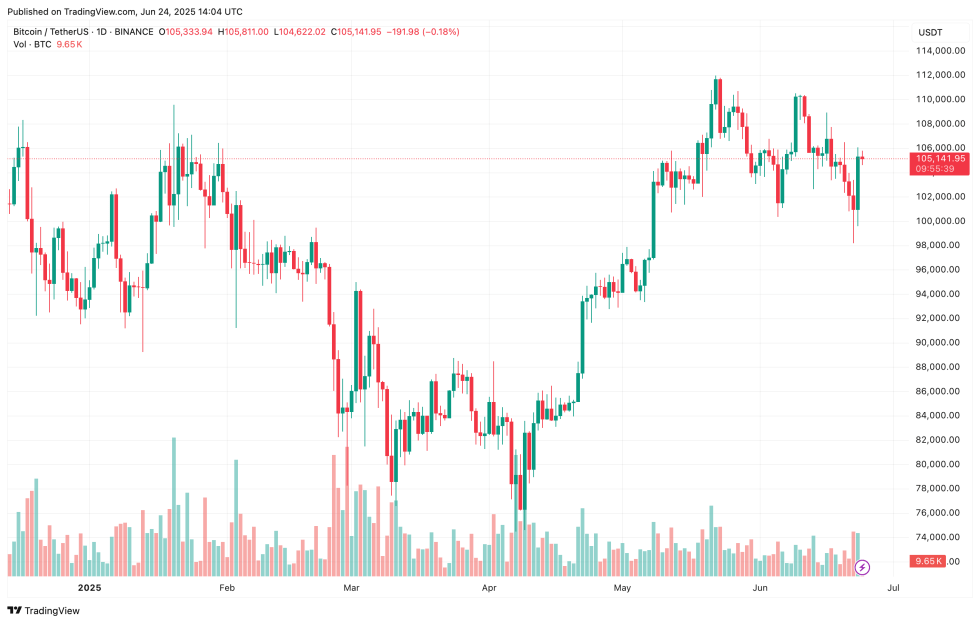
Nonetheless, not all indicators project positivity. Recently, transfers from miners to exchanges have surged to unprecedented levels, which could indicate mounting sell-off pressures from Bitcoin miners. As of now, BTC is trading at $105,141, marking a 2.6% increase within the last 24 hours.