Recent analysis of the Bitcoin network reveals intriguing trends in its activity metrics, particularly highlighting a disconnect between the number of active users and the overall transaction volume.
Intriguing Trends in Bitcoin Network Activity
According to the latest insights from on-chain analytics provider Glassnode, various activity metrics have shown contrasting developments over the last week, raising questions about the underlying dynamics of Bitcoin usage.

One of the focal metrics is the “Active Address Count,” which tracks the daily unique addresses engaged in transactions on the Bitcoin blockchain.
For a visual understanding, consider a graph illustrating the fluctuations in the Bitcoin Active Address Count over the past few years:
The above chart indicates that the Active Address Count surged earlier in the month when Bitcoin prices reached new heights, suggesting heightened user engagement correlating with the recent price rally.
However, as the price has retracted from its peak, the number of active addresses has noticeably declined, currently resting at 692,000—down 2.2% from the previous week. This figure falls below the midpoint range, signaling reduced engagement from retail traders.
In stark contrast, another critical metric, the On-Chain Transfer Volume, has unexpectedly risen.
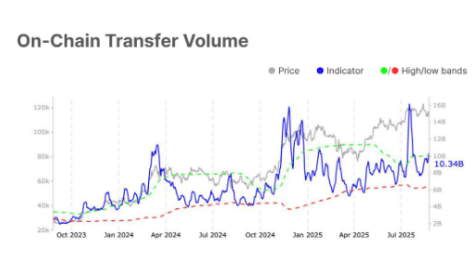
The chart shows that as Bitcoin prices reached an all-time high, the On-Chain Transfer Volume followed suit. Surprisingly, instead of reducing alongside the price, this metric has continued to rise, now sitting at $10.3 billion—an increase of 7.8% and exceeding its previous high statistical range.
This leads to an intriguing question: Why is On-Chain Transfer Volume climbing when the number of actively participating users has fallen?
The distinction lies in the types of investors represented by these metrics. The Active Address Count primarily reflects retail investors’ activities, while the On-Chain Transfer Volume is significantly influenced by transactions involving larger entities or “whales.” Thus, even as retail participation wanes, larger players may be capitalizing on market conditions to execute significant transfers.
This divergence in metrics could indicate a cooling off of retail speculative activity following recent price drops, while highlighting that whales are positioning themselves strategically.
Current Bitcoin Price Trends
In the last day, Bitcoin’s bearish trend has persisted, with prices dropping to approximately $109,900, further illustrating the ongoing turbulence in the market.