Ethereum’s recent advancement beyond the pivotal $3,000 mark has sparked a wave of optimism among traders, providing a temporary breather after a prolonged phase of uncertainty. Despite this positive shift, the cryptocurrency’s trajectory remains precarious, as it still falls short of the necessary technical indicators to reestablish a sustainable upward trend.
Recent analyses of both on-chain data and derivatives markets reveal significant developments. Notably, the 14-day moving average of the Taker Buy/Sell Ratio on binance has surged to 1.005, marking its highest level since July. A ratio exceeding 1 signals a predominance of aggressive buying activity over selling, indicating a rising bullish sentiment among derivatives traders.

However, it is essential to note that Ethereum is operating well below its previous cycle highs. This uptick in aggressive buying does not reflect strong market momentum, suggesting it could instead indicate early positioning or accumulation. Traders appear to be placing their bets before a potential breakout, rather than following the price as it rises.
Nevertheless, reliance on bullish sentiment in the derivatives market does not guarantee a significant trend reversal. For Ethereum’s recovery to evolve into a robust uptrend, this growing aggressiveness must coincide with a strengthened demand from the spot market and a definitive recovery of key resistance levels.
Increasing Derivatives Activity but Need for Validation
According to recent research, periods where Ethereum’s Taker Buy/Sell Ratio stays above 1 have historically correlated with heightened bullish activity or initial attempts to reverse trends. This phenomenon indicates that buyers are displaying urgency, opting for market orders rather than waiting for price dips, a typical sign of improving market sentiment.
This upward trend, however, carries cautionary notes. The Taker Buy/Sell Ratio is predominantly a derivatives metric, and elevated activity in leveraged markets does not automatically guarantee a lasting climb. Without signs of strengthening in the spot market—such as increasing trading volumes, net outflows from exchanges, or ongoing accumulation—price shifts driven by derivatives can quickly reverse.
Currently, the market structure hints at growing buy pressure within ethereum’s derivatives sector. This development raises the chances of a recovery attempt, especially if traders continue their proactive strategies instead of being reactive.
Ultimately, confirmation of this trend will require price movements to consistently breach critical resistance levels, alongside supportive evidence from broader market indicators, including spot demand and liquidity.
Ethereum Faces Crucial Challenge
With Ethereum recently rebounding above the $3,000 threshold, it has provided a momentary buoyancy following weeks of compression and downward price action. Despite this, underlying trends remain vulnerable. On daily charts, ETH continues to trade beneath the declining 100-day and 200-day moving averages, which are acting as vital resistance levels and shaping a bearish-to-neutral market landscape.
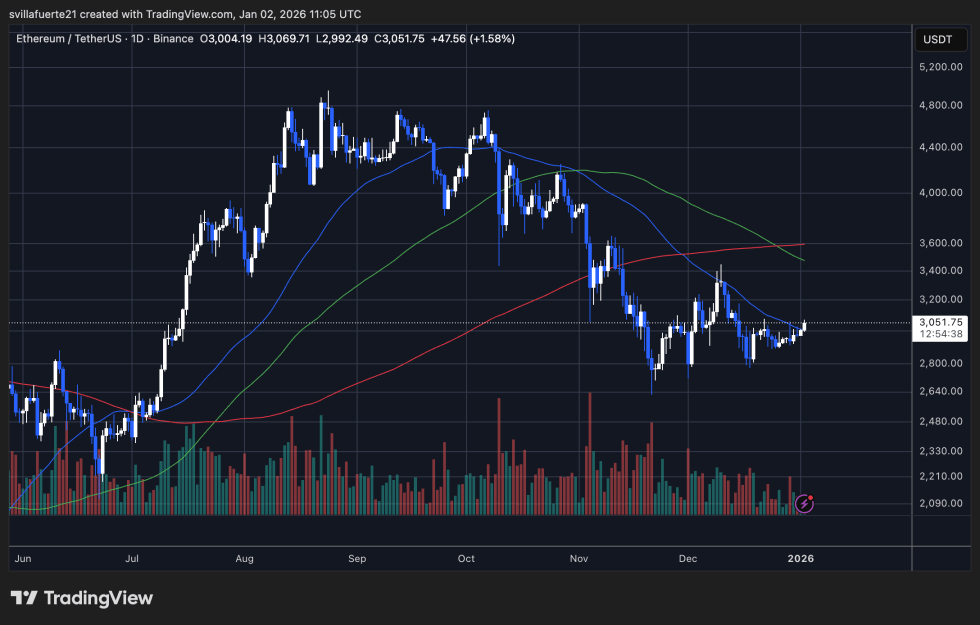
The latest price movement seems more corrective than aggressive. The trading volume has been limited, suggesting that buyers are hesitant. While recapturing the $3,000 level has symbolic importance, Ethereum has repeatedly struggled to maintain momentum above this mark since November, establishing it as a critical pivot rather than solid support.
From a structural viewpoint, Ethereum remains caught in a wide range between $2,800 and $3,400. The lower boundary has attracted buyers, yet upward movements often falter before reaching historic resistance levels. This persistent pattern indicates a balanced market where neither buyers nor sellers have enough conviction to drive a definitive trend.
Current momentum indicators suggest stabilization rather than a shift toward recovery. For Ethereum to realign with a strong upward trajectory, it must reclaim and sustain above the $3,300 to $3,500 range, coupled with increased volumes surging past the longer-term moving averages.
Featured image from ChatGPT, chart from TradingView.com