As the cryptocurrency market navigates through uncertainties, Bitcoin is currently facing challenges in maintaining its position above the $90,000 threshold. The lack of decisive movement suggests that traders are adopting a cautious approach, leading to a tug-of-war between hesitant buyers and persistent sellers. Although technical indicators and macroeconomic signals are in focus, there’s a less conspicuous aspect demanding attention: the behavior of Bitcoin miners.
Miner operations are accompanied by significant and often escalating costs tied to energy consumption, equipment, and ongoing management expenses. When the cost to mine exceeds the revenue, miners typically find themselves in a tough spot with two primary choices. They can either liquidate some of their coins to stay afloat financially or scale back production by deactivating some mining rigs, thus mitigating their losses.

Bitcoin mining fundamentally revolves around solving complex cryptographic puzzles with substantial computational resources. The system is designed so that new blocks are mined approximately every ten minutes. If the time to mine blocks fluctuates, the mining difficulty adjusts every 2,016 blocks to restore balance. These adjustments, alongside miner profitability, directly influence the network’s hashrate.
At present, we are witnessing a decline in the hashrate, indicating increasing pressure within the mining community. This trend indicates miners are reducing their operational capacity, which often correlates with greater market instability and heightened risks for Bitcoin holders.
Adjustment of Mining Difficulty Offers Relief
Recently, Bitcoin’s mining difficulty is showing signs of a potential decrease, hinting at some respite for miners who have been under relentless pressure. The latest recalibration indicates a drop of around 2.6%, and expectations suggest the impending adjustment could lower difficulty by approximately 1.88%. Although these numbers may seem modest, they could have significant repercussions for miner behavior and the larger market landscape.
A decrease in mining difficulty lessens the computational burden of mining operations, which can relieve some of the financial strain on miners. This change can enhance profitability even if Bitcoin’s price remains relatively stable.
This reduction in pressure can help stabilize mining efforts, diminishing the necessity for miners to sell their Bitcoin merely to cover operational costs. Historically, times when miner stress begins to recede have been accompanied by lower sell-side pressure from this group.
The dynamics of this situation can be observed through the Hash Ribbons indicator, which monitors both short- and long-term moving averages of the network’s hashrate to detect phases of miner capitulation and recovery. Current signals from Hash Ribbons suggest that we are in a post-capitulation state, where miner selling pressure seems to have largely subsided.
However, this indication may begin to wane. As mining difficulties decrease and operations stabilize, the likelihood of miners returning to full production increases. This return could drive the hashrate higher, marking a shift from the stress period and suggesting that the duration of miner-driven relief might be limited.
Price Movement Lacks Momentum Below Crucial Averages
Currently, Bitcoin is fluctuating within a broad consolidation range following a sharp downturn from its previous highs, with prices lingering around the $90,000–$92,000 mark. The price action indicates a struggle for stabilization after moving above the long-term moving average; however, the momentum upward remains stifled as it stays below significant mid-term moving averages, which now serve as reactive resistance.
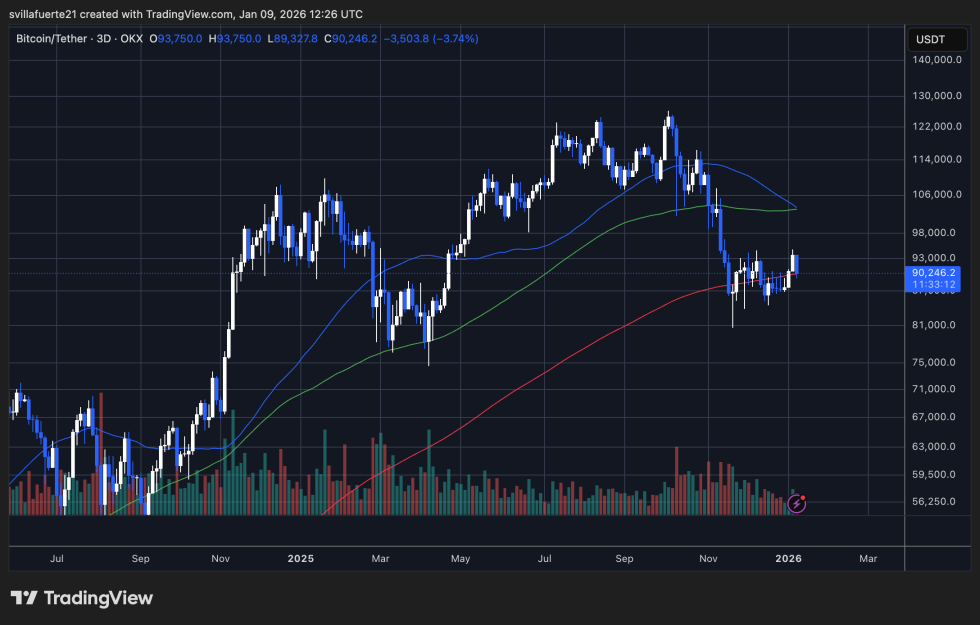
The recent uptick from the $85,000–$87,000 zone indicates that buyers are active in this demand region, which has consistently attracted buying interest since late November. However, the market structure maintains a corrective pattern rather than a strongly impulsive one. Each rebound has resulted in lower peaks, suggesting ongoing selling pressure during any attempts at recovery. Furthermore, trading volume remains subdued compared to the phase of decline, reinforcing the notion that this action represents consolidation rather than a reversal of trend.
From a structural point of view, Bitcoin is caught between a significant resistance level around $95,000–$98,000 and key support close to $85,000. A conclusive breakout above the 100-day and 200-day moving averages would be necessary to validate a shift toward a bullish market. In the absence of such movement, continued sideways trading or another test of the support level appears likely.
In summary, the current chart reflects a market in a state of equilibrium: while sellers have lost some control, buyers still lack the determination required to propel Bitcoin into a sustained upward trajectory.
Image credit: ChatGPT, chart data from TradingView.com.