As the cryptocurrency landscape evolves, Ethereum has recently regained traction, climbing above the $2,100 mark. This resurgence signifies a potential shift in market dynamics following a period of increased volatility. While the market has shown signs of stabilizing, there are indications that Ethereum may be on the cusp of a significant recovery.
Recent analytical insights shed light on Ethereum’s performance. According to a report by CryptoQuant, the behavior of trading activities on Binance reflects notable liquidity shifts. The 30-day Exchange Liquidity Ratio captures the balance between the trading volume and the available assets on the exchange, revealing critical trends in trader engagement.
The data reveals that Ethereum trading on Binance has soared to approximately 29.6 million ETH over the past month, marking a high point not seen since last September. This surge indicates that traders are increasingly active, suggesting a reinvigorated interest in Ethereum as it seeks to establish a more stable foothold.
Increased turnover often signifies a vibrant market phase characterized by heightened activity. As more participants engage in trading, it creates an environment where liquidity expands and confidence begins to build. This uptick in Ethereum trading could signal a shift from cautious posturing to a more assertive market sentiment.
Liquidity Metrics Indicate Growing Market Engagement
The CryptoQuant analysis highlights the noteworthy 30-day Exchange Liquidity Ratio for Ethereum on Binance. This insightful metric elucidates actual trading volumes in relation to the total ETH reserves on the exchange, painting a clear picture of market dynamics.
Currently, Binance holds approximately 3.5 million ETH, while trading activity has surged to 29.6 million ETH within the same timeframe. This significant volume illustrates that ETH is changing hands multiple times, driving the liquidity ratio up to about 8.47, a sign of robust exchange utilization.
From a structural viewpoint, increased turnover often correlates with periods of substantial price fluctuations or strategic realignment among market participants. When coins are exchanged repeatedly, it suggests traders are proactively adjusting their positions in response to shifting market conditions.
Historically, spikes in trading volume have been associated with heightened market engagement and rapid capital shifts. However, it is essential to interpret this activity thoughtfully. Elevated trading numbers can also emerge from speculative trading or as ETH being utilized as collateral in derivative transactions.
Related Article: Analyzing Shifts in Trading Activity: Unpacking XRP’s Market Dynamics on Binance
Ethereum’s Bid for Stability Post-Correction
Presently, Ethereum trades around $2,150 after experiencing a notable downturn that transformed its market trajectory. Following a peak exceeding $4,500 in 2025, ETH faced a downward spiral characterized by lower highs and sustained selling pressure. This downturn escalated in early 2026, driving prices temporarily below the crucial $2,000 threshold before a slight recovery took shape.
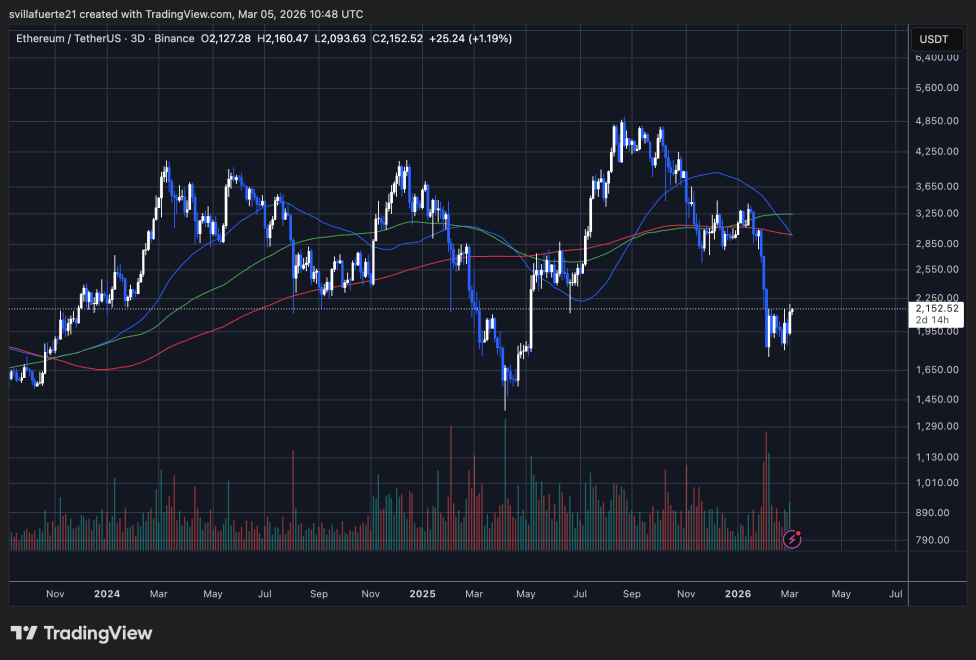
From a technical analysis standpoint, Ethereum continues to reside below vital moving averages, including the 50-day, 100-day, and 200-day indicators. These moving averages currently present dynamic resistance levels between approximately $2,800 and $3,300. As long as Ethereum remains beneath this cluster, the market conditions appear to favor bearish trends.
Nevertheless, recent price action from the $1,900 level suggests buyers are striving to establish a robust support zone. Movement toward the $2,100 to $2,200 band hints at the onset of a short-term stabilization period following an earlier phase of aggressive selling.
Although spikes in trading volume during the recent decline indicated strong liquidation, the current consolidation in price points to diminishing volatility. For Ethereum to shift toward a more favorable market structure, reclaiming the $2,400 to $2,600 range and achieving higher highs would be essential in the daily trading context.
Image credit: ChatGPT, chart from TradingView.com