As Bitcoin faces increasing challenges, it has struggled to maintain its position above the crucial $120,000 threshold and is now teetering on support around $115,000. After encountering resistance near the $125,000 level, volatility has surged, leading to a cautious market sentiment among traders.
Although BTC reached remarkable all-time highs a week ago, the cryptocurrency has since pulled back into a consolidation pattern, fluctuating between significant support and resistance levels. Investors are growing apprehensive as signs of momentum begin to wane, leaving Bitcoin susceptible to declines if demand diminishes.
Recent insights from CryptoQuant reveal a noticeable drop in demand at current price points, while momentum indicators indicate a possible exhaustion after an extended period of rising prices. This decline is particularly worrying against a backdrop of robust resistance at $120,000, where many short-term holders might consider realizing their profits.
If the $115,000 support level holds firm, it could set the stage for a renewed upward momentum, but a fall below this point might trigger a more extensive correction. With volatility making a return, market participants are focused on Bitcoin’s ability to maintain support and re-establish stability before its next significant move.
Apparent Demand for Bitcoin Shows Signs of Weakening
Leading cryptocurrency analyst Axel Adler points out that one of the key indicators to watch currently is Bitcoin’s Apparent Demand. This metric assesses the net change of short-term holders (less than one year) who have been actively trading. Positive readings indicate a healthy circulation and engagement from newer investors, while negative readings suggest that coins are transitioning into the hands of long-term holders, signifying lower engagement from fresh market entrants.
At present, the metric remains optimistic, reporting approximately 30,000 BTC in circulation. This indicates that demand still exists; however, the momentum behind that demand is evidently fading. A downward trend toward zero might imply a decrease in new investments, raising red flags about the potential for fresh capital inflows.
Adler emphasizes that the overall market landscape still favors long-term sustainability, as older coins are gradually finding their way to more stable holders. Nonetheless, the slowdown in activity from younger investors poses a concern at a pivotal time when Bitcoin struggles to maintain its footing below record highs. Observers are keeping a close eye on these developments, as continuing declines could reveal oversized vulnerabilities just before Bitcoin’s next substantial shift.
Ongoing Consolidation of BTC Below Significant Resistance
Bitcoin is grappling with escalating volatility, especially evident in the 4-hour trading chart, as prices linger around $115,573. Following several unsuccessful attempts to retake the $123,217 resistance level, BTC has entered a brief downward trend, moving beneath crucial moving averages. The 50-day Simple Moving Average (SMA) has dipped below the 100-day SMA, with the looming 200-day SMA acting as a formidable resistance point, suggesting a bearish trend may persist in the short run.
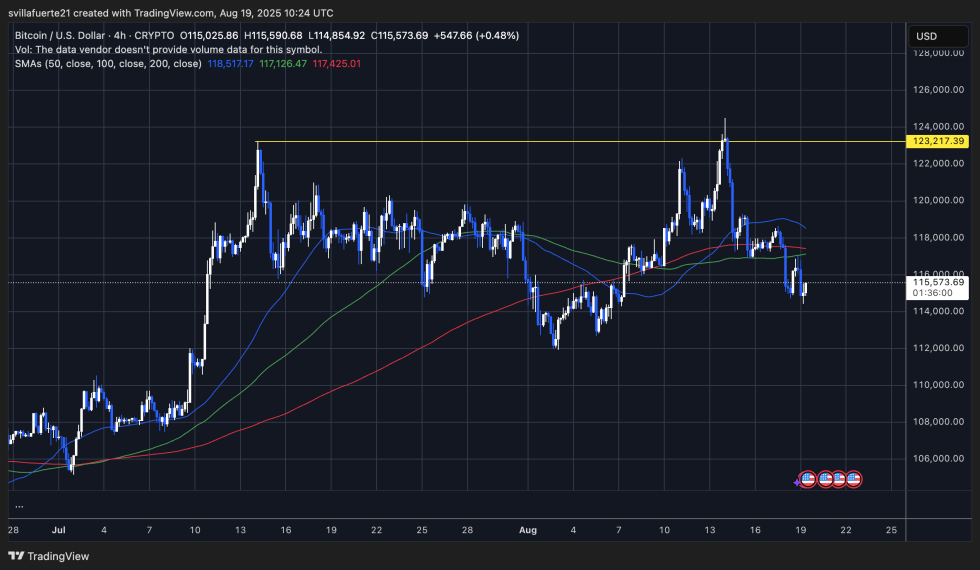
The pullback from the $123K mark has pushed Bitcoin into a consolidation stage, with sellers actively defending the $118K–$120K zone. Current price dynamics suggest that $115K is the crucial level to observe; a sustained break below this could unveil deeper corrections down to $112K or even $110K. Increasing trading volumes during drop-offs further evidence mounting selling pressure.
Conversely, should Bitcoin manage to uphold the $115K threshold and solidify a foundation, bulls might target another rally towards $118K. However, current momentum indicators reveal that buyers are tiring, implying that consolidation may linger before the market experiences a decisive shift. For the moment, BTC finds itself caught between resistance at $123K and critical support at $115K, with upcoming sessions poised to significantly influence its short-term trajectory.
Image credit goes to Dall-E; chart sourced from TradingView.