As Bitcoin navigates the intricate landscape of cryptocurrency investments, it is encountering significant resistance at the $118,000 milestone. Following a recent 25 basis point interest rate cut by the Federal Reserve, which ignited positive sentiment across various financial markets, Bitcoin managed to gain some upward momentum. Many investors view this as a potential catalyst for a bullish trend, speculating that Bitcoin could edge towards the $125,000 landmark if buying pressure continues to sustain.
Market analyst Axel Adler emphasizes that the current structure of Bitcoin’s market is conducive to ongoing positive movements. He describes the consolidation phase just beneath the resistance levels as indicative of strength; bulls are actively defending higher lows, while liquidity at critical points continues to grow. This behavior is often a precursor to significant breakouts when momentum aligns with broader financial parameters.

Yet, challenges remain apparent. Although the Fed’s decision has set a favorable backdrop, the failure to decisively breach the $118K limit keeps market volatility high. Traders are keenly observing Bitcoin’s ability to maintain its upward trajectory and extend its rally or if the market will endure another phase of consolidation before exploring higher demand zones. The upcoming trade sessions may indeed be pivotal.
Bitcoin Market Metrics: A Deeper Insight on Stability
According to analyst Axel Adler, the Z-Score (Long-Term Holder Market-Value-to-Realized-Value over 365 days) dropping below zero has been frequently misinterpreted. A negative Z-Score does not imply that long-term holders (LTH) are incurring losses. Currently, with Bitcoin hovering around $117,000, while the LTH Realized Price (RP) is approximately $35,000, the LTH MVRV ratio stands at a notable 3.3. Since values exceeding 1 indicate profits, it is evident that LTH are maintaining substantial gains. The current profit margin may be slightly below the year’s average, signaling a cooling trend rather than market weakness.
This cooling trend is crucial in illustrating a more stable market environment. Adler points out that the dip in the Z-Score is indicative of new demand absorbing older supply, a trend that has remained favorable since Bitcoin surpassed $70,000. Coins acquired at inflated prices earlier in the year are transitioning to the LTH category, consequently lifting the realized price and compressing excessive profits, which helps mitigate speculative exuberance that could destabilize the market prematurely.
Historically, sharp upward movements in Z-Score have been linked with market peaks, indicating aggressive LTH sales and selling pressure. The current shift implies that peaks are becoming more dispersed, less intense, and shorter-lived; new demand entering the market is counteracting their effects. This points toward a structural evolution in which Bitcoin can maintain elevated prices without inciting the same overheating conditions seen in previous cycles.
In essence, the existing Z-Score trend does not signal an impending downturn but instead highlights the market’s resilience. A blend of persistent LTH profits, well-managed risk levels, and continuous new demand paints a promising picture for future advancements, ensuring that the long-term optimistic outlook remains intact.
Current Price Dynamics: The Battleground at $118K
Currently trading around $116,500, Bitcoin recently tested the $117,100–$117,300 range but is still facing challenges at the pivotal $118K resistance. The charts reflect that BTC has embarked on an upward trajectory since early September, successfully reclaiming the 50-day SMA (blue) and firmly surpassing the 100-day SMA (green), which now serves as a support line. The 200-day SMA (red), showing an upward trend, further reinforces the medium-term bullish landscape.
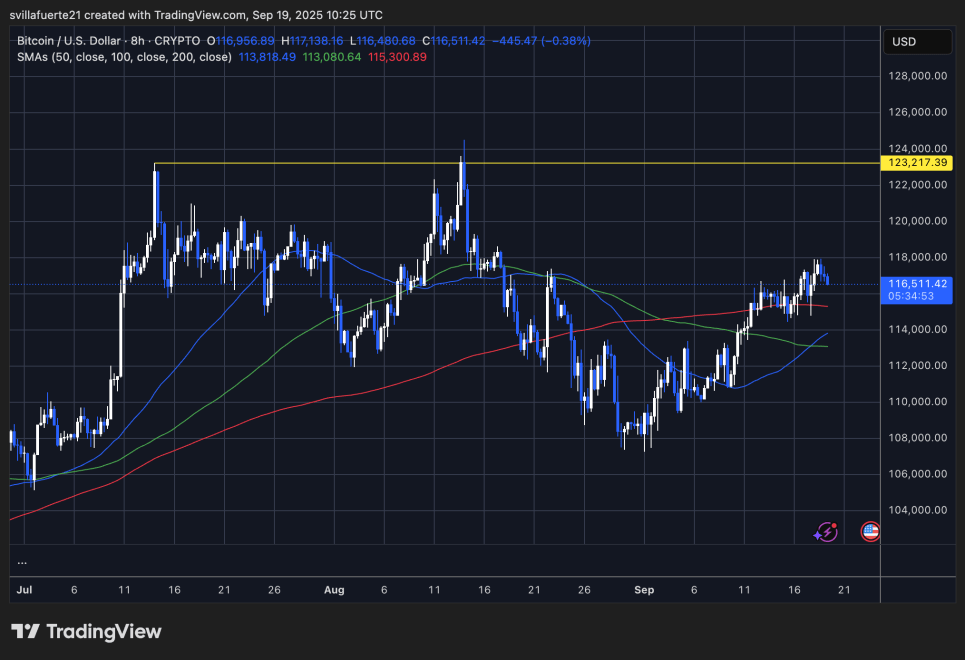
However, the yellow horizontal line at $123,217 marks a significant resistance zone where Bitcoin has faced multiple rejections since July. Currently, the market is consolidating near this level, suggesting that bulls require a stronger momentum surge to penetrate this barrier. A sustained breach above $118K could potentially set the stage for a push towards the $123K–$124K range, which, if successfully breached, might open avenues toward new all-time highs.
Conversely, initial support is identified around $115,300 (200-day SMA on this timeframe), followed by a stronger zone around $113,000. Maintaining positions above these levels would ensure the bullish structure remains intact.
Featured image from Dall-E; chart from TradingView.