Ethereum continues to face challenges in recovering from recent downturns, reflecting a mounting wariness in the cryptocurrency market as resistance levels hold firm. Having attempted various recoveries, ETH is stuck in a precarious position that mirrors broader market uncertainties. While some analysts offer optimistic perspectives, an increasing faction warns of a possible bear market looming in 2026, pointing to weakening price momentum and softening market sentiment as critical indicators.
In this context, on-chain metrics are gaining traction among investors. Recent data reveals that a notable Bitcoin trader, previously successful in navigating market declines, has made a bold move involving a significant Ethereum stash. This action has sparked interest and speculation, particularly due to the trader’s established history within the market.

The implications of this transaction are hotly debated. Some believe it indicates a defensive strategy as risks rise, while others see it as a tactical prelude to market fluctuations. Irrespective of opinions, movements by prominent traders often signal potential shifts in market dynamics, especially in times of technical vulnerability.
As Ethereum lingers under critical resistance, all eyes are on possible outcomes of this on-chain activity: will it lead to further selling pressure, or might it hint at a more complex repositioning strategy? With fragile sentiment in place, these upcoming days could be crucial in determining Ethereum’s trajectory.
Ethereum Whale Moves Ignite Speculation
On-chain analysis conducted by Lookonchain has identified a hefty transaction from a prominent Bitcoin trader. This individual is known for wielding a considerable $717 million exposure across Bitcoin, Ethereum, and Solana. Recently, 100,000 ETH — valued around $292 million — was moved to Binance, catching the attention of both analysts and traders alike.
The transaction’s scale raises eyebrows, compelling many to view it as a significant market signal rather than a mere routine action.
Three primary interpretations have arisen regarding this transfer. First, it may be a risk management strategy. By moving ETH to an exchange, the trader could be preparing to either liquidate or hedge positions amidst market turbulence. Secondly, it might serve collateral management, where assets are moved to meet margin requirements or to adjust leverage. Lastly, it’s plausible that this transfer could be meant for a quick trade execution, devoid of any intent to divest fully.
While the deposit does not definitively suggest an impending sell-off, it does imply ongoing risk assessments by the trader. With Ethereum under pressure from technical indicators, the market remains vigilant regarding whether this transfer foreshadows broader distribution tendencies or is merely a strategic adjustment.
Ethereum Finds Support Amid Market Consolidation
Currently, Ethereum is trading close to the $2,930 mark, showing signs of consolidation following a dramatic drop from peaks around $4,800 to $5,000. While the price remains above long-term support, the recent market structure displays a noticeable decline in momentum. Ethereum seems to have shifted from a bullish momentum phase to a corrective environment, evidenced by lower peaks and rising pressure at resistance zones.
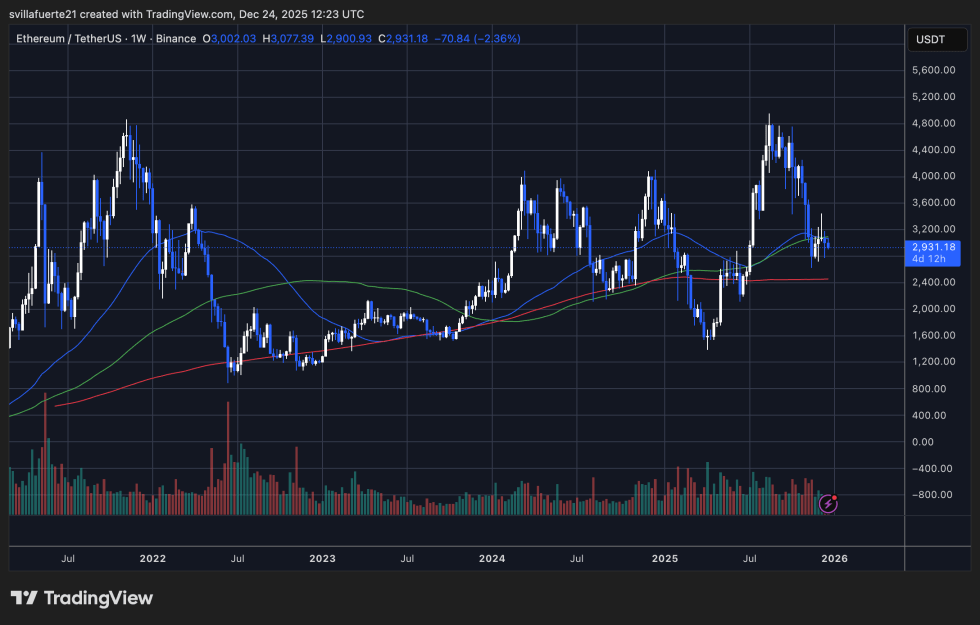
From a trend analysis perspective, Ethereum is currently navigating around its medium- and long-term moving averages. The recent loss of the faster weekly average marked the end of a bullish emotive phase. Currently, ETH is testing the critical 200-week moving average, an area known to have historically influenced key market transitions. This location is becoming increasingly pivotal between long-term traders and those looking to capitalize on previous gains.
Market behaviors over recent weeks have showcased uncertainty rather than capitulation. There have been instances of significant downward movements succeeded by smaller trading sessions, indicating that while aggressive selling is subsiding, buying interest has yet to dominate. Trading volumes also reflect this trend, with heightened activity occurring during initial sell-offs and a more subdued response during periods of consolidation.
The $2,800 to $3,000 range stands out as a crucial support level. Surviving this zone would enable Ethereum to maintain a bullish long-term structure. Conversely, a downturn below this level could trigger a deeper correction phase, while price stability could set the stage for revisiting key resistance levels of $3,400 and $3,800.
Featured image from ChatGPT, chart from TradingView.com.