As we delve into the current state of cryptocurrency markets, an important focus is on Bitcoin’s price movements. Recently, Bitcoin has been trading between $62,000 and $69,000. This narrow range reflects the uncertainty attributed to geopolitical factors affecting global financial landscapes. The price behavior showcases a lack of decisive direction, with buyers still defending the $62K mark while failing to surpass $69K, indicating a cautious market sentiment.
Recent analysis by Crypto Insights Group has highlighted an unusual shift in Bitcoin’s typical seasonal trends. Historically, February has been a robust month for Bitcoin, often showing considerable gains, but this year was different. Bitcoin experienced a decline of approximately 15%. Various factors contributed to this dip, including liquidity concerns and imbalances in market leverage.

At the start of February, Bitcoin was valued close to $84,000. However, the data suggested emerging stress in the market. Indicators like the SOPR were below 1, showing that many investors were trading at losses. Additionally, flat Realized Capitalization pointed towards a slowdown in investment flowing into Bitcoin. Furthermore, the lack of consistent buying interest on platforms like Coinbase suggested that demand was not returning strongly.
Market Pressure from High Leverage and Diminished Spot Activity
The steep decline in mid-February was not merely a result of selloff sentiment; it was driven largely by leverage unwinding. As selling pressure mounted, many leveraged positions were liquidated, causing a cascading effect in the market. Primary data, including open interest, saw a sharp drop, confirming that this was a reaction to the derivative markets, not steady sell-off from spot trading. In thin liquidity environments, these leverage corrections can significantly enhance market volatility.
Despite the prevailing Fear & Greed index indicating extreme fear in the market, this sentiment alone was not enough to instigate a recovery. Often, capitulations result in temporary price bounces rather than establishing a healthy market bottom.
Another key factor was the inconsistent spot trading activity. Although exchange-traded fund (ETF) inflows were observed, they did not show a consistent, long-term positive trend. Moreover, the muted growth in stablecoin supply signaled a lack of capital ready for market entry. This led to price rebounds primarily driven by short-covering rather than genuine accumulation.
The broader economic context has made the market even more fragile. Weakness in equity markets and a strong dollar positioned Bitcoin not as a safe asset, but rather as a highly volatile trading option. The structural discrepancies in supply and demand have overshadowed the historical patterns we usually observe during this time of year.
Support Levels Tested as $69K Becomes Critical Resistance
On a weekly chart, Bitcoin’s price appears to be attempting stabilization around the $66,000 area. After facing strong resistance from the $90,000–$100,000 zone, a notable shift from expansion to distribution is evident. Following a peak in late 2025, the price has formed a series of lower highs and dipped below the essential 50-week moving average.
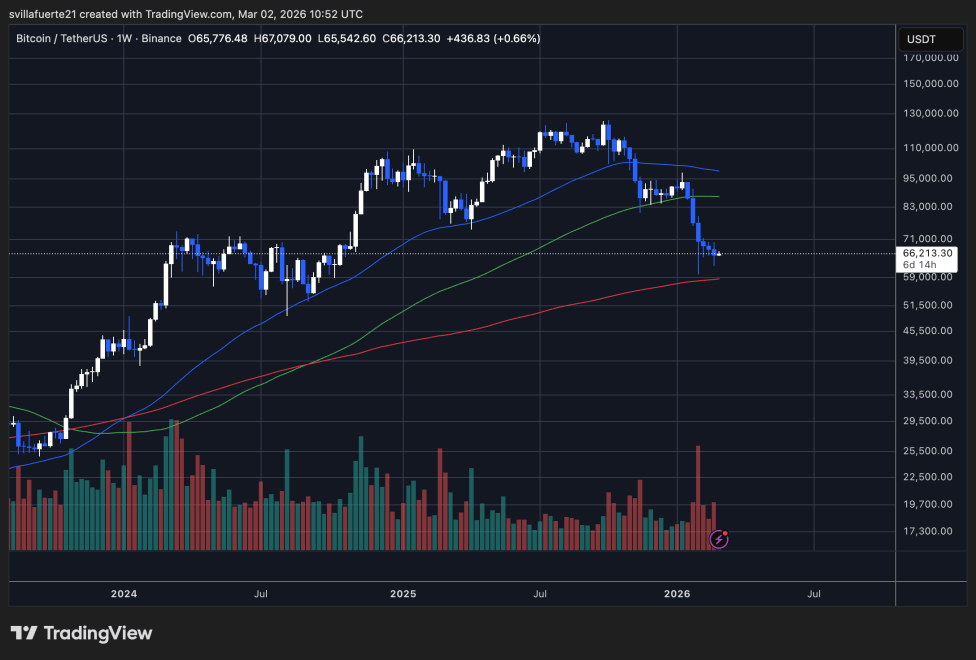 Bitcoin Price Behavior | Source: BTCUSDT chart on TradingView" width="976" height="660">
The breakdown intensified when prices slipped beneath the 100-week moving average, leading to a swift decline toward the mid-$60K range. Importantly, the 200-week moving average, situated near the high-$50K zone, remains intact; historically, this average has indicated the macro trend in bull markets. As long as Bitcoin stays above this level, it can be considered to maintain its long-term bullish structure.
During this downturn, trading volume surged, particularly on large red weekly bars, indicating forced selling rather than superficial distribution. However, recent candles have shown a consolidation phase with reduced negative momentum, suggesting a temporary balance between buying and selling pressures.
Technically, the $69K mark now serves as crucial resistance. A firm close above this threshold could signal a path back toward the 50-week moving average. Conversely, failing to hold the $62K level could result in deeper tests of the 200-week moving average.
In summary, the future trajectory of Bitcoin will heavily depend on sustained spot market inflows and careful rebuilding of leverage ratios, essential for establishing a healthy price environment.