As Bitcoin approaches the $82,000 mark, market participants are watching closely as buyers test resistance levels that have historically been a challenge. Recent price movements suggest a constructive trend, yet analyst Axel Adler sheds light on the realized profit and loss data, offering a detailed perspective on Bitcoin’s recovery journey. The insights gained are both promising and reveal ongoing challenges.
One of the key metrics analyzed by Adler is the 30-day ratio of realized profits to realized losses. This ratio serves as an indicator of market sentiment, determining whether more participants are selling at a profit or at a loss. A ratio below 0.5 indicates that losses are dominating, which signifies a state of panic selling. In this scenario, fear drives holders to liquidate their positions regardless of their acquisition costs.
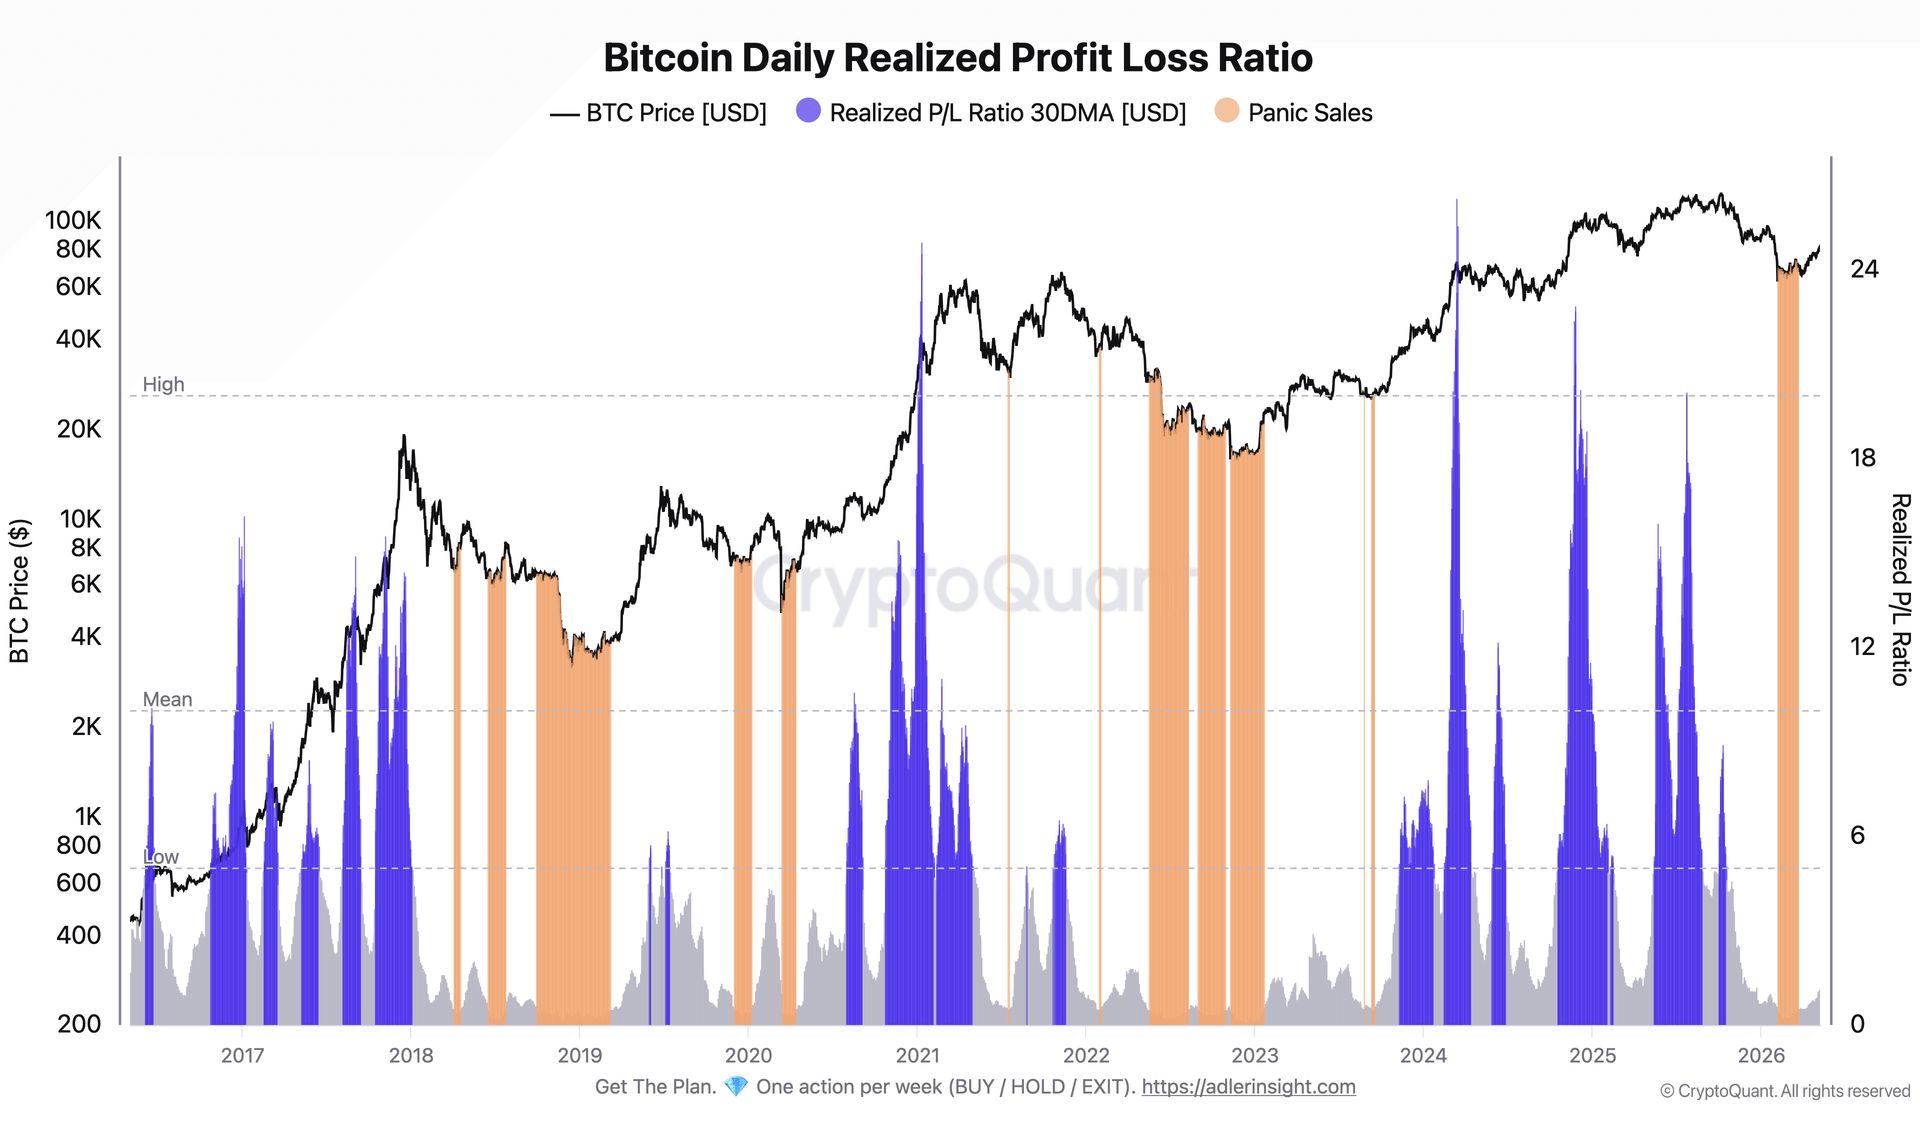
Bitcoin entered this panic selling zone on February 5, 2026, hitting its lowest point on February 21, when the ratio dropped to 0.26, indicating a severe imbalance favoring losses at nearly a four-to-one ratio. This distressing phase lasted until March 21.
By May 10, the ratio had rebounded to 1.13, with Bitcoin hovering around the $80,000 mark. This recovery signifies a departure from forced liquidation, marking the end of the capitulation phase. However, the implications of this shift warrant further examination, as highlighted by Adler’s study.
The Panic is Concluded: Capital Inflows Remain Limited
Adler’s second metric offers a precise calibration of the ongoing recovery. The Realized Cap Net Position Change tracks the 30-day average fluctuations in Bitcoin’s realized market capitalization, indicating whether new capital is infusing the network or if the overall capital base is diminishing. A positive figure suggests an expanding market, while a negative figure indicates a decline.
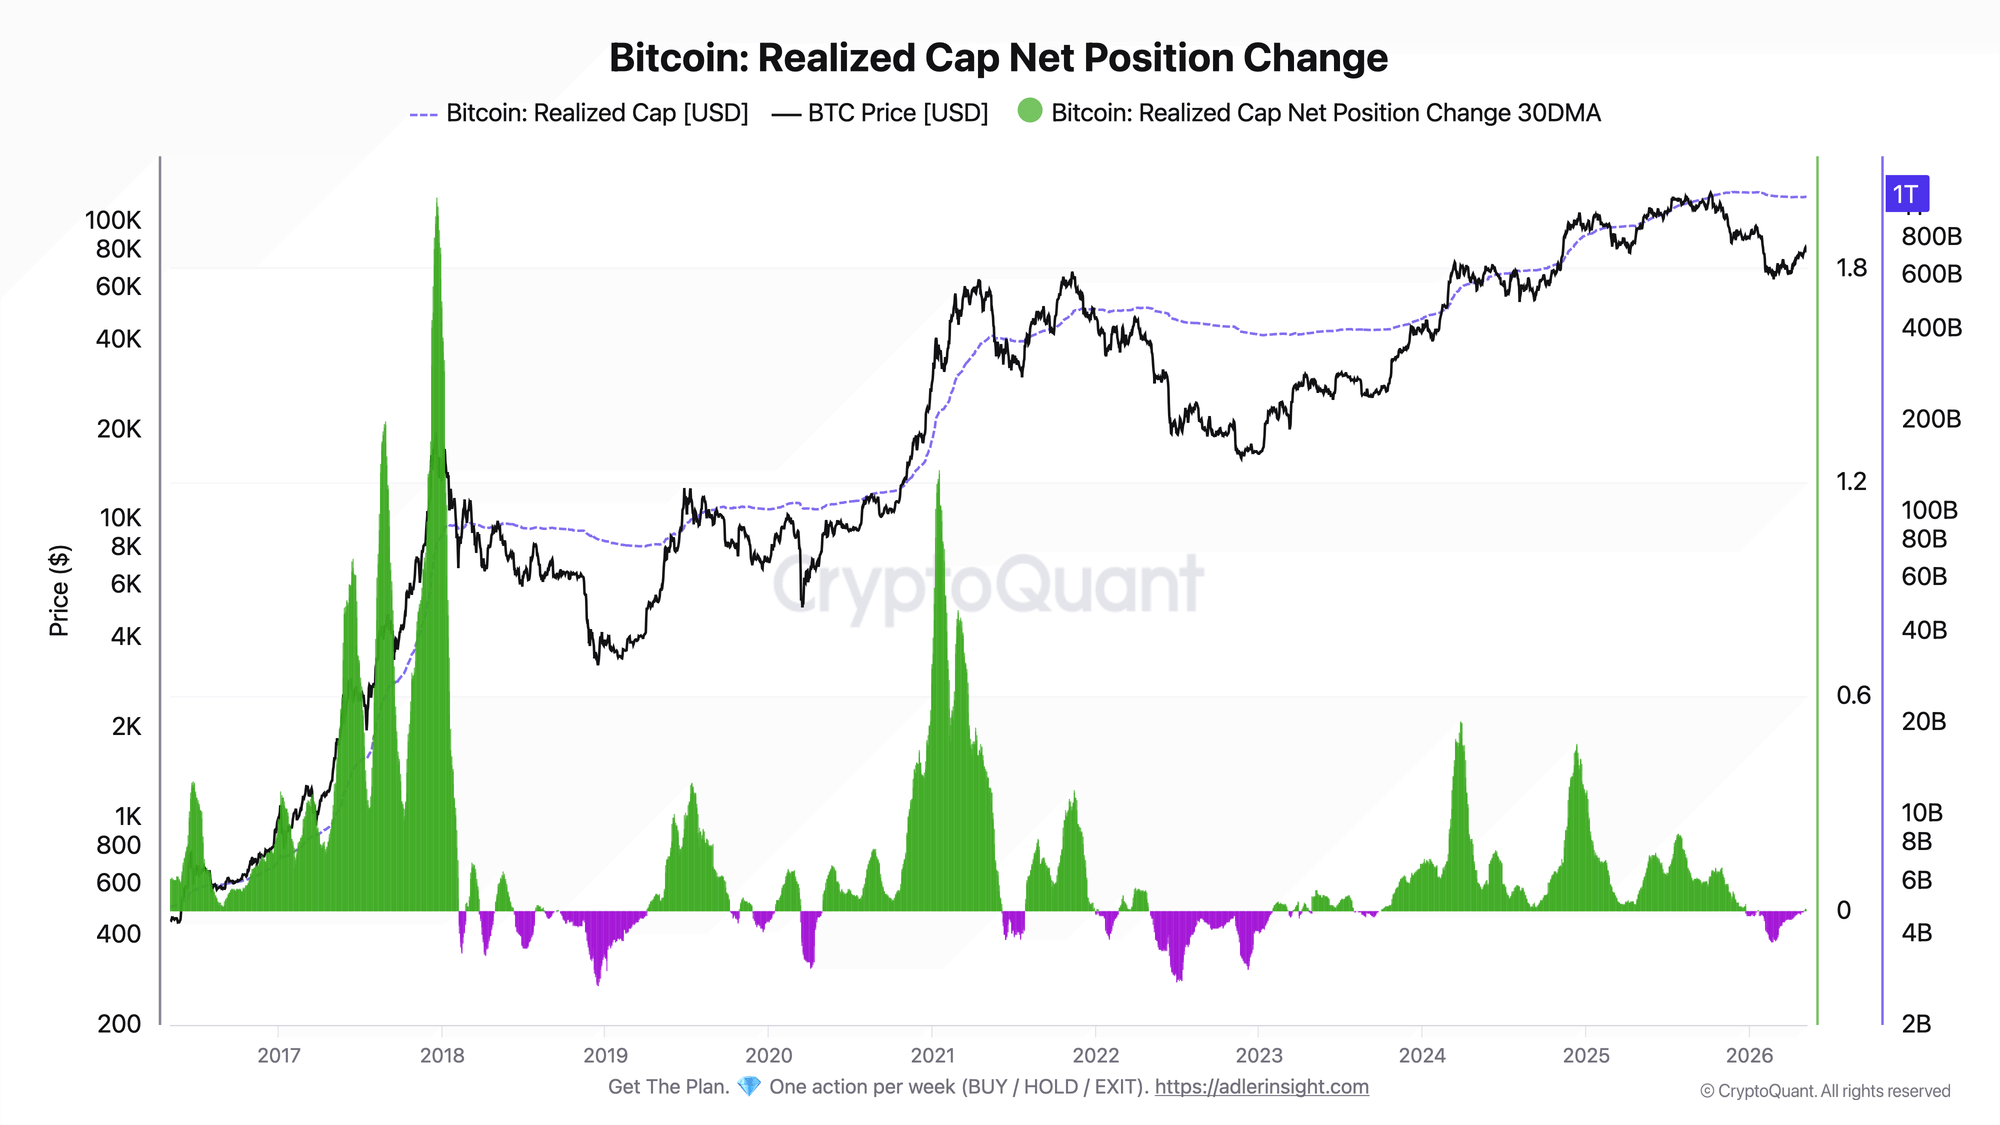
In February 2026, this metric reached a low of -0.087% on February 20, indicating that capital was exiting the network significantly. It bounced back above zero on May 2, signaling the end of the contraction phase, and stood at +0.008% by May 10.
When contextualized historically, this figure reveals its significance. The expansion peaks in March 2024 and December 2024 were +0.534% and +0.472%, respectively. The current +0.008% reading shows a recovery that is approximately 98% weaker than those earlier surges, indicating a return to positive territory that lacks substantial momentum.
The two metrics together paint a comprehensive picture of Bitcoin’s status. The first confirms that the panic selling has ceased and that the period of capitulation from February 5 to March 21 has concluded. The second indicates that the capital inflows necessary for genuine expansion remain elusive.
Thus, while the market is recovering from its previous lows, it has not yet reached a phase of broad capital expansion. Understanding this distinction is crucial as it shapes expectations for Bitcoin’s next market cycle.
Bitcoin Approaches Resistance as Recovery Momentum Slows
Bitcoin is now trading just above the $80,000 mark following a robust recovery from lows near $60,000 experienced in February. The overall market trend appears constructive, with Bitcoin consistently achieving higher lows throughout its recovery phase. Additionally, it remains well above the rising 50-day moving average, currently situated around $73,000.
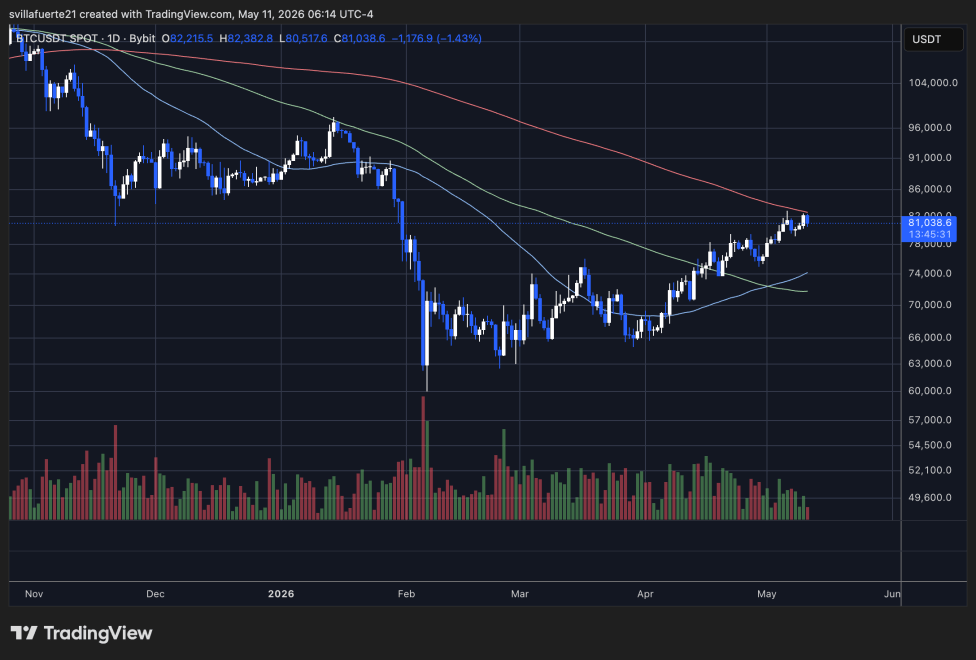
However, the charts indicate a slowdown in momentum as Bitcoin approaches a crucial resistance cluster between $81,000 and $83,000. This area coincides with a declining 100-day moving average, which has hindered several attempts to break through in recent weeks. The ongoing difficulty in decisively reclaiming this level suggests that sellers remain active, even amidst broader recovery efforts.
Volume trends further support the narrative of consolidation. Trading participation has diminished compared to the earlier aggressive rebound seen in March and April, implying the market is moving into a temporary equilibrium following weeks of upward movement. This moderation in activity could lead to reduced short-term volatility but may require stronger demand to support another upward leg.
Importantly, despite ongoing resistance, Bitcoin has not exhibited signs of structural weakness. Buyers have consistently defended pullbacks above the 50-day moving average, upholding the trend of higher lows that characterize the current bullish recovery.
A successful breakout beyond the $82,000 resistance level might open avenues to the $86,000–$90,000 range. Conversely, failure to maintain support above $78,000 could signal a shift back toward consolidation or potential retracement.
Overall, the current landscape presents a mix of optimism for recovery interspersed with the necessity for substantial capital inflows to sustain further growth.