The cryptocurrency landscape remains tumultuous, with Bitcoin hovering around the crucial $66,000 mark. As investors navigate this unpredictable arena, many are seeking clarity amidst the fluctuations.
Today, Bitcoin has established its place within a range between $64,000 and $70,000. This performs a dual role: it indicates uncertainty and reflects a significant decline from last cycle’s peak. This decline illustrates the dynamic nature of the market, which is ever changing and evolving.
Interestingly, recent analyses uncover a pivotal shift in market behavior. Data shows that whale activity, particularly selling on major platforms, has diminished significantly. This retreat of large holders could signify a turning point, indicating the market is gradually stabilizing.
Whale Behavior: A New Perspective
Recent insights into whale activity reveal intriguing trends. In previous months, substantial BTC inflows to exchanges pointed towards a phase of distribution, suggesting bearish sentiments among significant players.
As of late, we are witnessing a notable decrease in bitcoin deposits by these whales. The current average inflow has contracted, reflecting a potential shift to a more cautious approach. It seems these large holders are now more reserved, creating an environment ripe for speculation.
While this absence of aggressive selling indicates a softer bearish pressure, it does not intrinsically equate to bullish momentum. With large players taking a sideline approach, market conditions are becoming increasingly critical to observe.
Investors remain vigilant. The upward resistance remains almost palpable, while any support from below appears tentative, producing uncertainty that weighs on sentiment.
Current Market Dynamics: The $66,000 Benchmark
The cryptocurrency market, particularly Bitcoin, finds itself oscillating between $66,000 and $67,000 following previous volatility. After a steep drop defining trading patterns of the last month, Bitcoin reflects a transitional structure.
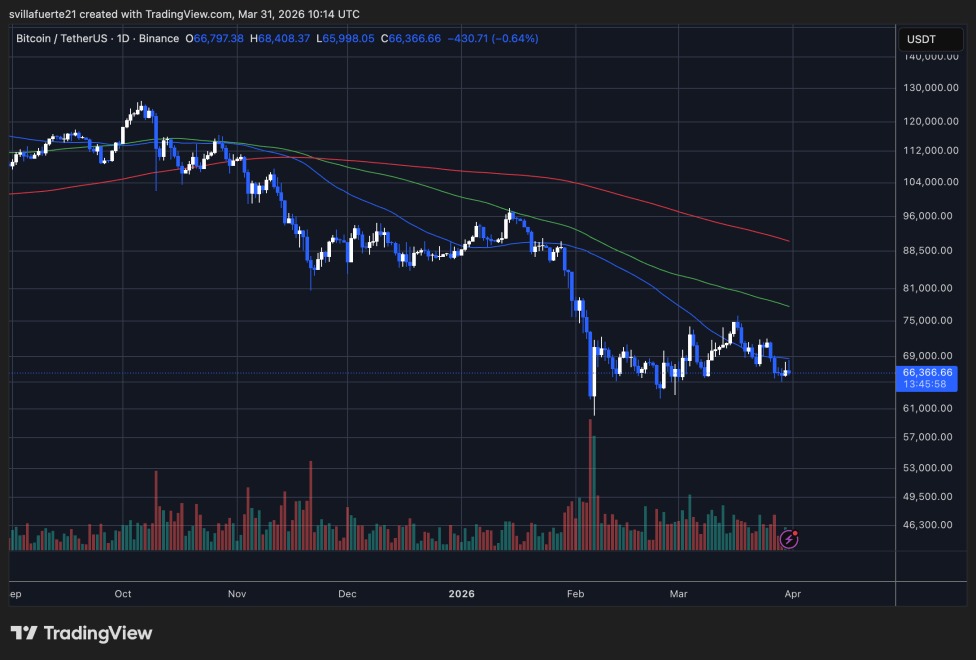
Nevertheless, the prevailing structure remains largely pessimistic. Bitcoin struggles beneath its 50-day and 100-day moving averages, which are both tracing a downward path, acting as considerable resistance. Each attempted rally has been met with downward pressure near the $68,000 to $70,000 thresholds, reinforcing these levels as key resistance points.
Volume metrics further corroborate this analysis. The most considerable spikes occurred during periods of forced selling, hinting at a capitulation phase. Since those high-stress moments, volumes have stabilized, indicating a potential reaccumulation phase without a definitive bullish breakout.
As the price action tightens towards the lower end of the current range, it suggests a slight demand presence; however, this alone manifests insufficient strength to catalyze upward movement. Observers note that breaking above $72,000 could signify a shift in momentum. Conversely, if the market dips below $63,000, it could trigger renewed selling pressure, possibly leading to lower liquidity levels.
Image sourced from ChatGPT; chart captured from TradingView.com