The cryptocurrency market is experiencing notable shifts as Bitcoin grapples with fluctuating prices after reaching an impressive peak of $124,000. Recently, it has dipped below the $115,000 mark, sparking a wave of uncertainty among traders and investors alike. This pivotal moment could either ignite rapid gains or lead into a prolonged phase of market consolidation that tests the resolve of its supporters.
Market analysts have different viewpoints regarding this downturn. Some suggest it’s a necessary pause following a robust surge in prices, while others warn of potential further declines should key support levels crumble. Notably, analyst Darkfost has observed an intriguing trend in the derivatives market. His analysis highlights that the Binance Taker Buy-Sell Ratio has hit an alarming low, an indicator that may signal a buying opportunity amidst bearish sentiment.

Traditionally, significant drops in this ratio can indicate overexposure to bearish positions, which often precede strong rebounds. As Bitcoin lingers near essential support zones, the forthcoming days will be crucial in determining whether this indicator prompts a resurgence or leads to further price consolidations.
Understanding the Binance Taker Buy-Sell Ratio
Darkfost asserts that the taker buy-sell ratio serves as a vital tool for gauging market sentiment within the derivatives landscape. This ratio measures the relationship between aggressive buying (taker buy orders) and selling (taker sell orders). A ratio above 1 suggests a bullish atmosphere, while a value below pivot suggests a bearish sentiment with overwhelming sell orders.
The current reading stands at 0.95 on Binance, indicating that selling pressure has eclipsed buying demand—typically a precursor to further declines. However, as Darkfost notes, market behavior often runs counter to prevailing expectations, hinting that the momentum could flip when least anticipated.
Historically, sharp reductions in this ratio have paved the way for noteworthy recovery phases, as markets tend to rebound strongly once selling pressure subsides. Each plunge to such levels has created advantageous buying conditions, potentially setting the stage for significant price rallies.
If buyers respond positively while Bitcoin hovers near critical support, this contrarian indicator could signal an upcoming surge, marking a critical turnaround in the market’s dynamics.
Bitcoin Faces Critical Support Levels
Bitcoin’s daily chart reveals a concerning trend, as it struggles to maintain its upward momentum following its recent all-time high. Trading at approximately $113,467, Bitcoin is testing a vital support range just above the 100-day moving average, which currently lies at $111,140.
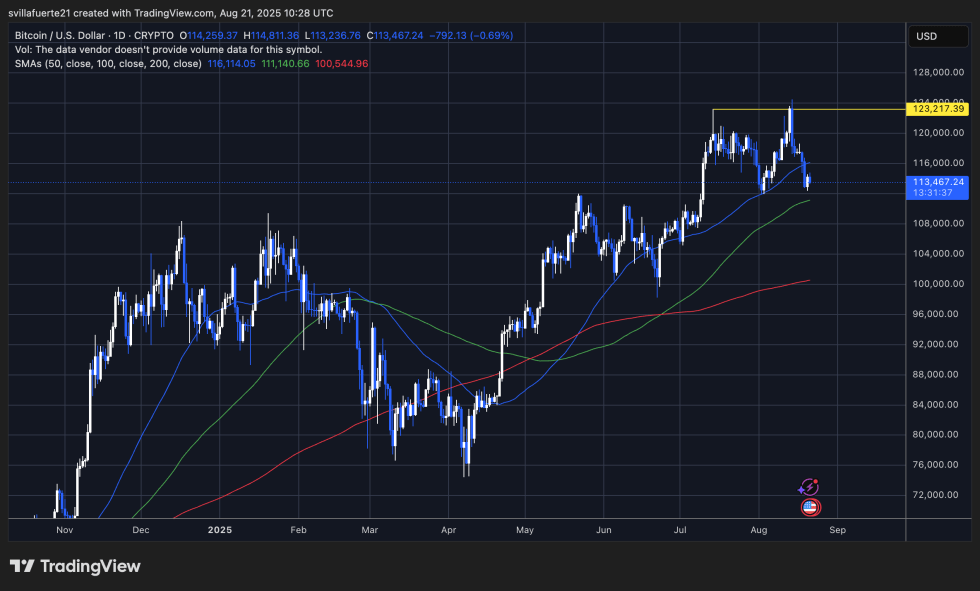
The chart indicates a significant shift in momentum since Bitcoin could not maintain its price above $123,217, creating a scenario where sellers dominated, leading to lower highs. This development has pushed the price toward crucial moving average clusters, with the 50-day SMA also turning into a resistance point, further indicating short-term bearish tendencies.
The immediate objective for the bulls is to support the $113K–$111K range. Maintaining this level is vital for any potential rebound, especially if larger market narratives or on-chain accumulation begin to strengthen. Conversely, if this support fails, a deeper decline becomes increasingly probable.
In conclusion, Bitcoin’s short-term trajectory remains uncertain as it enters a consolidation phase amid a broader uptrend. The next few trading sessions will be instrumental in determining if the market stabilizes for new upward attempts or takes a more bearish turn.
Image credit from Dall-E, chart sourced from TradingView.