The price of Dogecoin has been stabilizing around the $0.1 level, with significant price movements noted recently. In the face of this market instability, it exhibits a distinctive historical chart pattern that analysts consider bullish. If Dogecoin maintains this pattern, it could potentially skyrocket by 300X to achieve new All-Time Highs (ATHs) at $30.
Buyers Eager for Dogecoin’s Price to Surge
Trader Tardigrade, a crypto expert, has identified a promising technical pattern in the Dogecoin chart, indicating a possible upward momentum toward new ATHs. Announcing this on October 5 via X (formerly Twitter), the analyst noted that Dogecoin is trading above the 200-day Simple Moving Average (SMA).
The 200 SMA is crucial for understanding the long-term trend of a cryptocurrency. Tardigrade compares Dogecoin’s present movements with historical patterns from 2017 to 2020.
The analyst believes Dogecoin’s present actions echo its past upward trends and could lead to a symbolic bullish rally. Between 2017 and 2019, Dogecoin experienced a substantial price increase before entering a “pre-rally stage” and undergoing another price surge from 2021 to 2023.
Per Trader Tardigrade’s observations, Dogecoin may now be on the brink of another upward move. The analyst forecasts a 300X surge taking it to $30, before a pullback to around $6.
Past Trends Indicate a Major Upsurge Ahead
In a recent post on X, analyst Ali Martinez shared that the current price movements of Dogecoin resemble a historical multi-year descending triangle pattern.
Previously, Dogecoin broke free from this critical triangle structure, which led to a remarkable price boost of nearly 200%. After this surge, the price adjusted by 60% before entering another significant bull run.
With the current formations mirroring the historical descending triangle, it suggests a prospective upward breakout. Martinez also noted a 65% price pullback, indicating that Dogecoin is well-positioned for its “next big rally.”
According to Martinez’s analysis of the Dogecoin chart, prior to 2017, the coin surged by 229.58% to $0.00035 after breaking the descending triangle pattern. Likewise, a breakout from the same pattern between 2018 and 2021 spurred a 138.04% rally, raising its price to $0.00318.
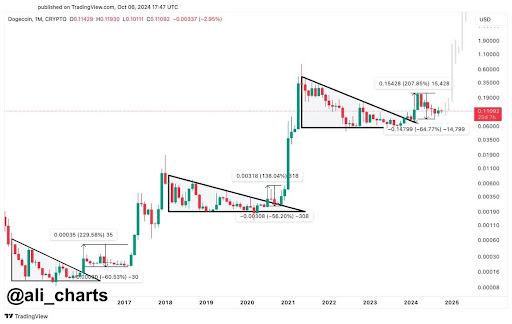
Given that Dogecoin’s latest descending triangle pattern has been forming since 2021, continuing through 2024, Martinez anticipates a 207.85% increase, propelling the meme coin above $0.15.