The cryptocurrency landscape is undergoing a fascinating shift, with Ethereum recently experiencing significant fluctuations after a period of impressive growth. As the second largest digital currency, Ethereum has reached peaks not seen in years, yet it now faces the challenge of maintaining the crucial support level around $4,200. This threshold not only acts as a safety net for investors but also reflects the ongoing interest from institutional buyers who continue to accumulate ETH, even amidst the chaos of the broader financial markets.
One of the key highlights in this recent phase is the disparity in exchange behaviors between Ethereum and Bitcoin. Over the past month, these two assets have exhibited very distinct patterns in their exchange inflows. Bitcoin has maintained relatively stable inflows, suggesting a robust but cautious market sentiment, while Ethereum has seen a marked increase in coins flowing onto exchanges, stirring speculation among traders.

This contrasting behavior indicates a more volatile environment for Ethereum. The rising inflows may suggest profit-taking from long-term holders or strategic repositioning by large stakeholders anticipating significant market events or shifts within the Ethereum ecosystem. Nevertheless, the enduring interest from institutional investors, combined with positive long-term fundamentals—such as a declining supply on exchanges—provides a solid foundation for Ethereum’s future. Market watchers are keen to see if ETH can hold the $4,200 resistance and find stability for another push upward.
The Contrast: Bitcoin and Ethereum Exchange Trends
Recent data provided by CryptoQuant illustrates a clear distinction in the exchange inflows for Bitcoin (BTC) and Ethereum (ETH), pointing to fundamentally different market conditions. Bitcoin’s inflow levels have remained moderate, fluctuating between 12,000 and 70,000 BTC daily, which indicates a relatively stable sentiment among holders.
While occasional spikes in inflows were noted in mid-July and early August, these were not sustained, reinforcing the notion that Bitcoin holders are not rushing to sell. This stability contributes to a perception of calm surrounding Bitcoin, despite the volatile nature of its price movements.
Conversely, Ethereum is experiencing a surge in exchange inflows. Over the last few weeks, inflows have consistently surpassed 2 million ETH daily, even peaking near 2.6 million. This marks a significant increase compared to late July, indicating a shift toward more aggressive trading behavior among Ethereum holders.
The uptick in inflows suggests potential profit-taking by major holders or a repositioning ahead of anticipated changes in the Ethereum ecosystem. This indicates that Ethereum is entering a more active trading cycle, potentially leading to short-term selling pressure that could significantly affect its price trends.
The stark contrast in inflow activity underlines the current market dynamics—while Bitcoin reflects relative tranquility, Ethereum indicates an uptick in trading activity. Traders should be vigilant, as sustained inflows into ETH could either result in a market correction or pave the way for renewed bullish momentum, depending on liquidity absorption in the marketplace.
In-Depth Analysis: Significant Price Levels
Ethereum recently faced a notable pullback after a period of strong bullish gains. Having reached highs around $4,790, ETH has since retreated to approximately $4,272, reflecting an 11% decrease. This shift brings the cryptocurrency closer to a vital support level at $4,200, where bulls are defending against any additional downside risk.
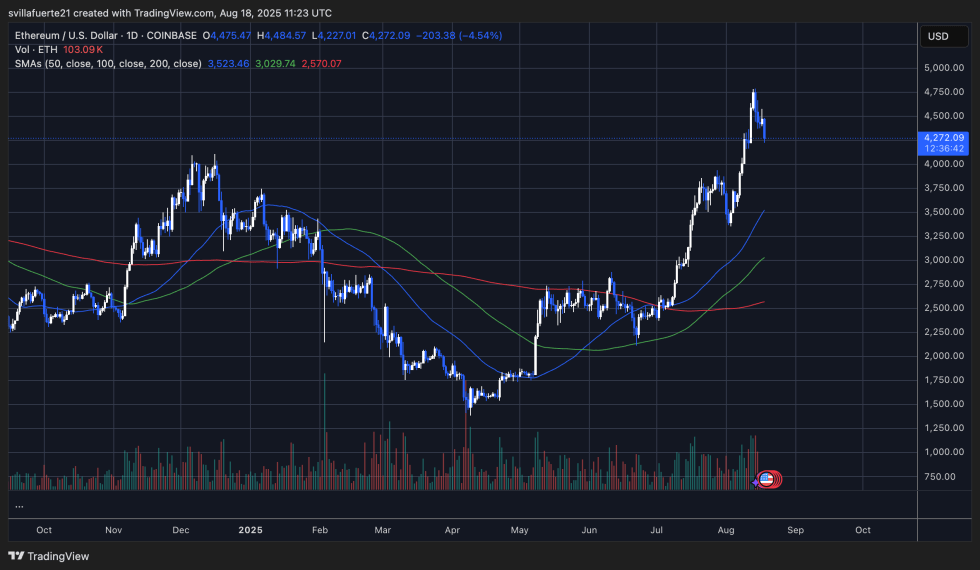
Analysis of the price chart indicates that Ethereum remains above crucial moving averages (50, 100, and 200-day), all trending positively, reinforcing an overall bullish outlook. Despite the recent dip, the long-term trend favors buyers, as Ethereum continues to form higher highs and lows since its early-year revival.
If ETH slips below the $4,200 support zone, it might open the pathway toward $3,800-$3,900; however, if the bulls can defend this crucial level effectively, it could lead to another attempt at reaching the $4,800-$5,000 area. The overall chart demonstrates Ethereum’s bullish potential, although the volatility continues to be a significant factor in this equation.
Image by Dall-E, chart sourced from TradingView to illustrate recent trends.