Ethereum has been hovering around the $2,300 mark, a notable point that signifies a meaningful rebound from earlier lows this year. Although it has gained some ground, it still remains far from the peaks seen in previous cycles. The current market environment is one of cautious observation, suggesting a potential for significant movement in either direction. Recent insights from the Arab Chain report provide deeper context for understanding the subtle shifts beneath the surface stability.
The Cumulative Volume Delta (CVD) for Ethereum on Binance has shown an uptick of about +48,400, indicating that buying orders are generally outpacing selling orders. However, this number should be viewed as a reflection of a cautious re-entry rather than a frenzied buying spree. This nuanced shift points to a gradual resurgence of buying pressure in a space that had recently been quieter.

With a correlation coefficient of 0.66 between price and order flow, there is a moderate affirmation that price movements are beginning to react to growing demand. Nevertheless, it also underscores that there are additional influences at work. Factors such as derivatives activity, external liquidity, and macroeconomic trends continue to play significant roles in shaping Ethereum’s price dynamics alongside the evolving order flow.
This indicates that we are witnessing a market recalibration, yet the process of returning demand is still in progress.
Buyers Are Gradually Reappearing
The Arab Chain report emphasizes that the current CVD reading should not be misinterpreted. A positive delta of +48,400 indeed signifies that buying exceeds selling. However, the relatively moderate number suggests that this is no massive institutional inflow but rather a steady increase in demand—a positive indicator for a recovering market.
This distinction is crucial for understanding how the current recovery should be assessed. A gradual uptick in demand typically leads to more sustainable price movements compared to abrupt surges, which can quickly reverse once the initial excitement wears off. The progress in CVD aligns seamlessly with the price recovery, suggesting that we are in a genuine phase of rebalancing rather than experiencing a temporary spike.
The 0.66 correlation coefficient serves as a candid reminder that spot order flow is not the sole driving factor behind Ethereum’s price fluctuations. External influences from derivatives positions, market liquidity, and broader economic conditions are also significant, reflecting a transitional market phase where the direction still remains uncertain.
The report presents a clear dual scenario for what lies ahead. Should the CVD continue to improve and the correlation approach 1.0, we may see a more defined upward trend. Conversely, if this momentum stalls and the CVD flattens, Ethereum may remain trapped in its current range until a new catalyst surfaces.
Current data leans towards the former scenario as being more probable, though it is important to keep the latter possibility on the radar.
Ethereum Faces Resistance as Recovery Tests Key Levels
Ethereum is currently consolidating within the $2,300 to $2,350 band, attempting to hold onto its gains from earlier volatility, albeit struggling to break through critical resistance levels. The price has shown a defined recovery pattern since dropping to $1,800, but it now faces a substantial technical challenge.
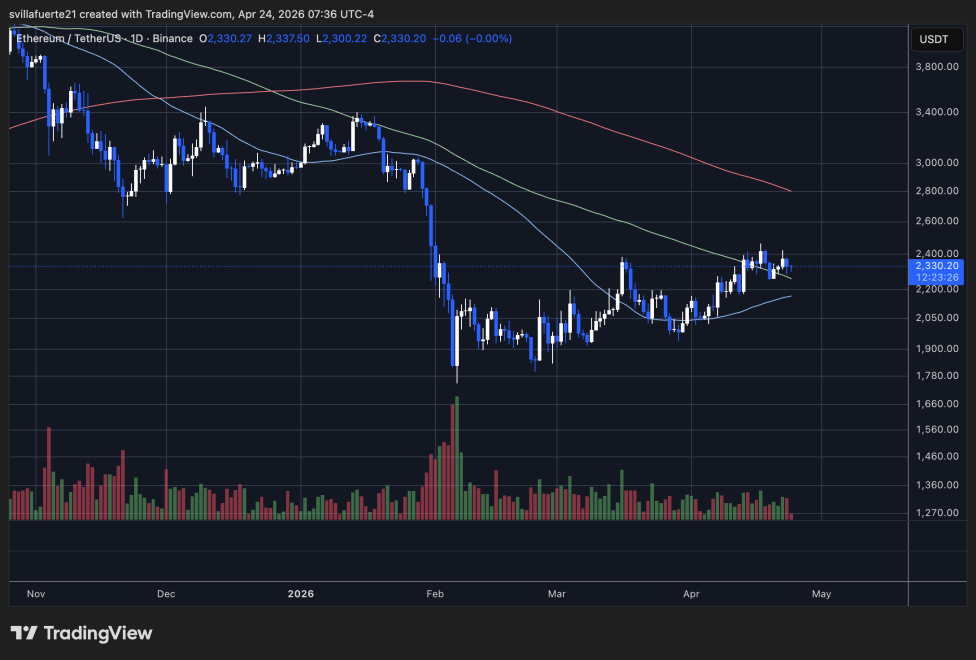
The resistance at the $2,400 level is compounded by the descending 100-day moving average. Each attempt to surpass this mark has been met with rejection, suggesting that supply remains a strong counterforce at this level. Meanwhile, the 50-day moving average is trending upward near $2,150, providing essential support and confirming bullish momentum in the short-term.
Volume trends are indicative of the current uncertainty in the market. The most substantial spikes in volume correlate with the February downturn, while the present recovery is marked by noticeably lower trading participation. This suggests that, while buying pressure is indeed returning, it is yet to reach the levels needed for a decisive breakout.
Should Ethereum succeed in overcoming the $2,400 resistance with conviction, the next critical target will likely be around $2,800. However, failure to achieve this could prolong the current consolidation, with potential downside risks reversing towards the $2,100 support area.
Featured image from ChatGPT, chart from TradingView.com