The recent fluctuations in the price of Ethereum have sparked discussions and analyses in the cryptocurrency community. On Friday, May 22, Ethereum entered a downtrend after a period of consolidation, experiencing a decline of approximately 6.2% and achieving a local bottom at $2,020.
Despite an apparent bearish market sentiment, insightful analysis reveals that there is significant buying activity taking place. This article explores the current dynamics affecting Ethereum’s price and outlines key on-chain metrics and market movements.
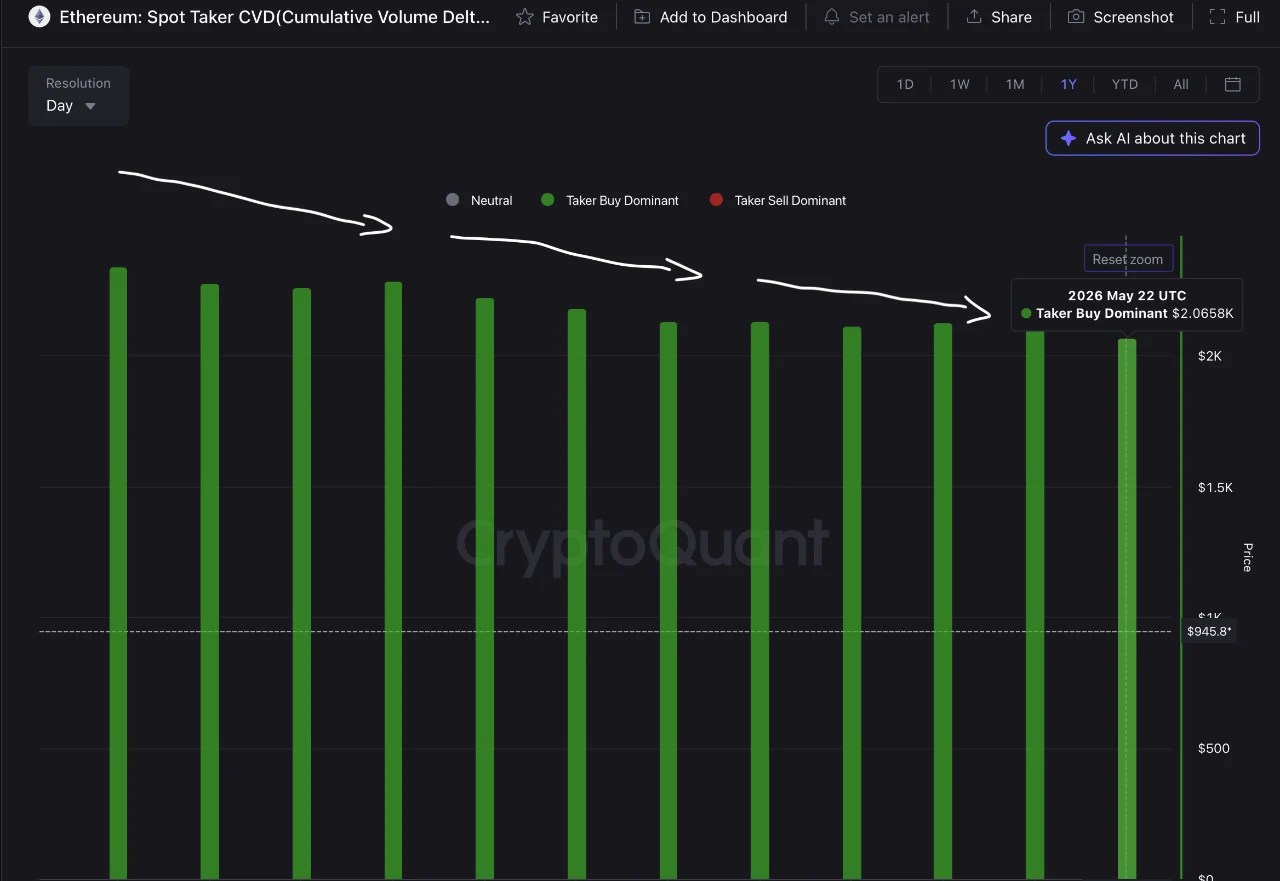
Spot Market Dynamics Indicate Strong Demand
According to a recent post by crypto analyst Carmelo Alemán on the CryptoQuant platform, the recent downward price trajectory of Ethereum does not stem from a lack of interest in the spot market. Instead, indicators suggest that the Spot Cumulative Volume Delta (CVD) indicates a dominance of buying activity.
Alemán further emphasizes that aggressive buyers in the market are placing more buy orders than there are sell orders. Even so, the price of Ethereum is struggling to gain upward momentum, contracting from $2,339 on May 11 to $2,065.8 by May 22.
Data suggests that overall spot trading volume has also undergone significant retraction since May 11, dropping from around 470,770 ETH to 256,963 ETH, a fall of over 45%. This decline represents a decrease in transaction value from $1.10 billion to approximately $521.4 million.
Derivatives Market Shows Contrasting Trends
In addition to spot market activity, Alemán pointed out the mixed signals emanating from the derivatives market. The Open Interest metrics have remained relatively flat, moving from $15.43 billion to $15.54 billion, reflecting a minimal increase of 0.69%.
Even while the futures cvd indicates that many traders are still holding long positions, suggesting anticipation of a price rebound, the Funding Rates have consistently remained positive. This implies that long traders are compensating short traders to maintain their positions, indicative of lingering bullish optimism.
Furthermore, Alemán observed that cumulative Exchange Netflow figures are in the negative, at around -80,507 ETH. This suggests a net outflow of Ethereum from exchanges, typically a bullish sign as it indicates that more ETH is being stored rather than sold.
However, the anticipated bullish impact of these movements has not yet materialized in the market price.
Alemán explained that the persistent bearish trend could be attributed to an increase in supply, thus overwhelming current demand levels. As a result, the expected bullish pressure from the spot and futures markets is being absorbed without translating into price gains.
Alemán noted, “Until ETH recovers spot volume, breaks resistance, and shows healthy growth in derivatives, the bearish influence is expected to persist. In the short term, the price may head toward the $1,984 support level, and if that level is breached, it could drop further to $1,937.”
As of this writing, the current price of Ethereum stands at $2,114, reflecting an increase of over 2% in the previous day.