Ethereum enthusiasts are keeping a close eye on recent price movements, particularly to see if a notable rebound from a critical demand zone will lead to a broader recovery. A prominent analyst on TradingView has identified potential price objectives reaching upward to $1,850.
Overview
- TradingView analyst IGT_Traders indicates early bullish signals in the ETHUSD market structure.
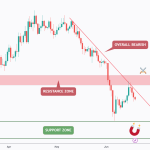
- The analysis highlights buyer activity defending the demand zone between $1,670 and $1,690 after recent price dips.
- Resistance levels are observed between $1,735 and $1,755, with bullish targets set at $1,750, $1,800, and $1,850.
- A strong close below $1,690 would negate the bullish outlook.
Demand Zone Support
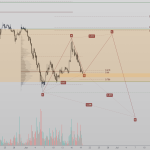
The TradingView analysis by IGT_Traders considers the ETHUSD trading pair in a preliminary bullish setup following a robust price reaction off the $1,670 to $1,690 demand zone. The analyst interprets this move as a potential liquidity sweep, indicating that prices briefly dipped below previous lows before bouncing back due to buyer participation.
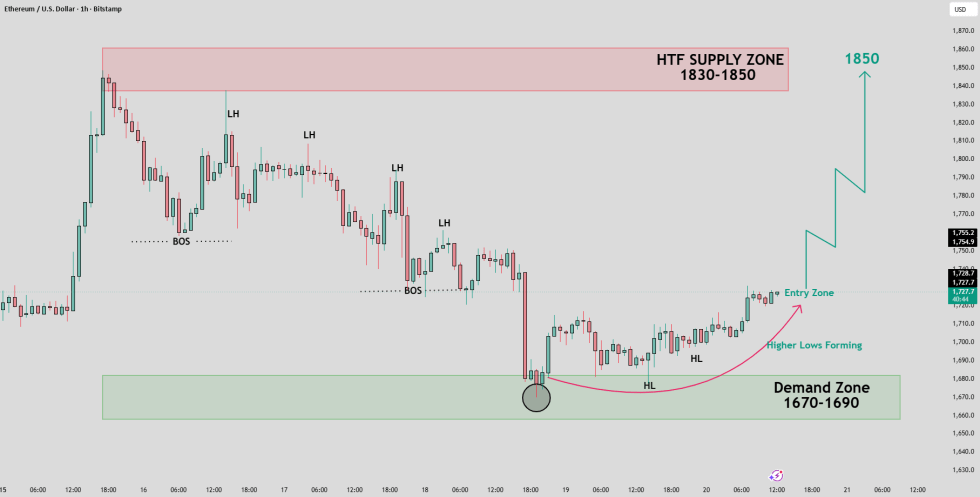
Understanding this behavior is crucial, as it may signal an exhaustion of aggressive selling. It implies that buyers are beginning to outpace sellers. The formation of higher lows further suggests a gradual shift in control towards buyers regarding short-term price influence.
However, this bullish setup has yet to be confirmed. The key resistance area to watch is between $1,735 and $1,755. A breakout above this range would reinforce the bullish narrative and indicate that the significant selling pressure may be diminishing.
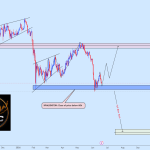
Price Targets: $1,750, $1,800, and $1,850
The analysis sets forth three primary bullish targets for Ethereum. Firstly, $1,750 acts as an initial point of resistance and liquidity objective. The second target is $1,800, where Ethereum would transition into a more significant supply zone on higher time frames. The third target, $1,850, represents a crucial liquidity goal and the upper limit of this broader supply region.
The trade dynamics are relatively straightforward: Ethereum needs to maintain its position above the demand zone, establish a series of higher lows, and successfully breach the resistance at $1,735 to $1,755. Should this unfold, trend-following traders could shift their focus to the $1,800 to $1,850 zone as the next possible point for supply to emerge.
It is important to note that this analysis reflects a short-term technical setup rather than a definitive long-term market trend. For sustainability, Ethereum must demonstrate the ability to uphold this regained structure during market pullbacks, rather than merely reacting to price dips from demand zones.
Risk of Invalidation Below $1,690
The primary invalidation level highlighted in this analysis is a significant concern for bullish traders. A decisive hourly close below $1,690 would invalidate the bullish perspective and indicate that sellers might have resumed control.
This level is particularly important as it defines the lower boundary of the demand zone. If Ethereum drops below this threshold, the argument regarding the liquidity sweep loses strength, raising the risk that the rebound will merely be another transient relief rally.
Currently, Ethereum’s short-term chart offers a framework for bullish support. It remains to be seen whether the asset can transition from a reactionary phase to a confirmation of this upward move.
This article reflects insights from technical analysis authored on TradingView by IGT_Traders, available at the source.