Ethereum is currently facing a crucial test around the $3,150 support level, following its decline from the $3,240 mark. This zone has become a focal point for traders, as they assess whether bullish momentum can successfully defend it. Recent fluctuations in the market have left many traders uncertain about Ethereum’s potential direction, particularly after a period characterized by significant volatility and aggressive sell-offs. While some market analysts suggest this retracement could signal the beginning of a recovery phase, others remain cautious, noting that further downward movement may be on the horizon.
Market expert Darkfost has pointed out a critical shift in the market dynamics influencing Ethereum’s price trajectory. Over the last few days, there has been a noticeable decline in spot trading volumes, which traditionally reflect real buying and selling activity. This drop in spot activity could lead to futures markets playing a more dominant role in dictating Ethereum’s short-term price fluctuations.

In Darkfost’s assessment, when spot volume weakens, the effect of futures contracts can magnify both bullish and bearish movements. As Ethereum hovers around this pivotal support level, all eyes are on the market for clearer indications of whether this recent rebound is merely a short-term reaction or the precursor to a more lasting recovery.
Impact of Futures on Ethereum’s Price Action
Darkfost elaborates on the structural implications of declining spot volumes, highlighting that decreased liquidity can lead to increased volatility. A lack of sufficient buy and sell orders can make the market more susceptible to abrupt price changes driven by futures speculation. This environment often manifests in larger swings and rapid shifts in price, particularly as leveraged trading amplifies the impact of these moves.
At present, the futures market is showing upward momentum, which may bolster Ethereum’s ability to maintain above the $3,150 support area. Darkfost suggests that this upward pressure might favor buyers, potentially creating an environment where increased volatility pushes spot buyers to re-enter the market with renewed confidence.
Nonetheless, this scenario has its risks. A lack of strong spot activity means that any reversal in futures trading could lead to accelerated declines, heightening the stakes for Ethereum’s short-term outlook. The cryptocurrency currently finds itself in a precarious phase where volatility could either ignite a rally or exacerbate its existing challenges.
Examining Ethereum’s Weekly Chart Structure
On the weekly chart, Ethereum is grappling to recover after experiencing a sharp decline from the $4,500 region. Recently, ETH has rebounded toward $3,140, regaining its 100-week moving average (indicated by a green line). This level has historically marked the threshold between medium-term bullish and bearish trends, making it a significant point of interest for traders. The bounce back indicates renewed demand at this vital level, particularly in light of recent aggressive buying attempts around the $2,700 zone.
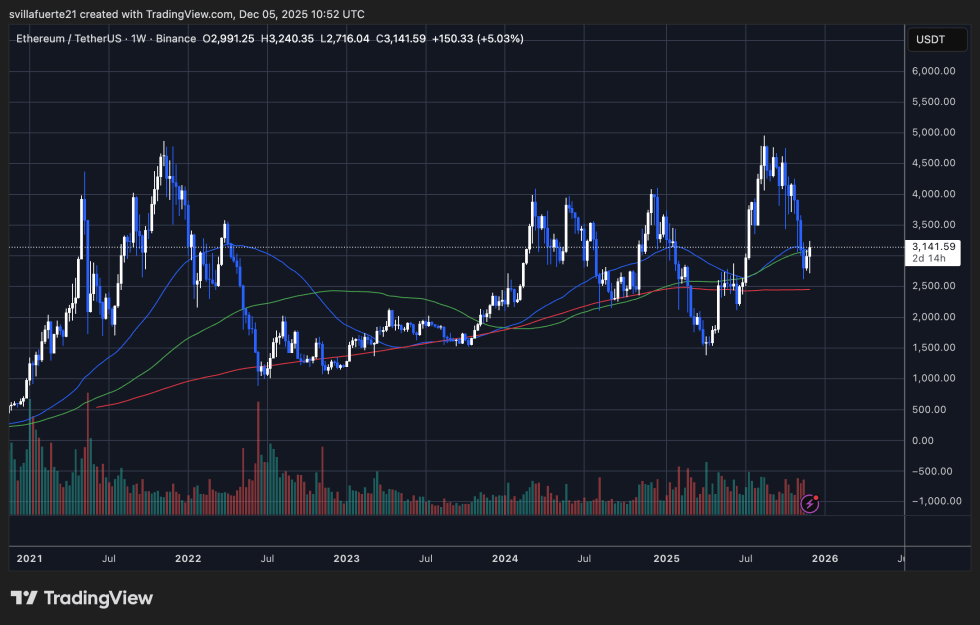
However, Ethereum continues to contend with significant resistance above. The 50-week moving average (blue line), now positioned between $3,400 and $3,500, has become a barrier for bulls. Overcoming this zone would substantially enhance ETH’s technical outlook and pave the way for testing higher price levels. Until such a breakthrough occurs, the prevailing trend is neutral to slightly bearish.
Volume trends indicate a positive signal, as the current recovery is marked by a rise in buying activity compared to previous weeks. This uptick suggests increased interest in these lower price levels. Nevertheless, the overarching pattern of lower highs established since August highlights the necessity for ETH to demonstrate consistent strength to avoid slipping back into prolonged consolidation.
Featured image from sources, chart data from TradingView.