The cryptocurrency market is currently navigating a turbulent phase, with XRP reflecting significant volatility. It has been observed trading under the crucial $1.40 mark, a point often regarded as a psychological barrier for traders. This situation mirrors a broader trend of market uncertainty and wavering momentum. Recent attempts at recovery have not been able to gain traction, leading to a more defensive posture among investors as they navigate potential risks.
In addition to price movements, recent data on derivatives offer a deeper insight into market dynamics. Analysts have noted a concerning trend in open interest for XRP, particularly on major platforms like Binance. This decline indicates that traders are opting to minimize their exposure rather than seek new opportunities. The current open interest level is around $372.6 million, which is notably the lowest it has been since early 2024. Such a decrease highlights a contraction in trading activity and serves as a warning signal for the overall health of the market.

The significant reduction in open interest underscores a broader trend of decreased leverage among traders. This shift may mitigate systemic risks; however, it also reflects a diminishing confidence among market participants, as fewer traders are willing to engage in speculative positions in the current climate.
XRP’s Market Positioning and Structural Changes
Analysts like Arab Chain from CryptoQuant are drawing parallels between the current situation and past growth periods in the XRP market. There was a time when strong bullish sentiment contributed to an upswing in open interest soaring beyond $1.7 billion. This was especially evident when XRP prices hovered over $3. In stark contrast, today’s $372.6 million figure signals a significant reduction in both market engagement and risk tolerance.
This discrepancy is indicative of a fundamental transformation within the market. Whereas past rallies were energized by high leverage and built-up speculative positions, the current market environment is marked by lowered exposure and cautious investment strategies. The decline in open interest coincides with XRP’s price drop to approximately $1.40, reinforcing the link between decreasing asset value and reduced derivatives trading activity.
This ongoing deleveraging process can arise from heavy liquidations during periods of instability or voluntary moves by traders as they seek to mitigate risk in face of uncertainty.
It is essential to note that declining open interest does not automatically signal bearish conditions. Often, this phase can pave the way for a healthier market environment following periods of excessive leverage and speculation. By eliminating overextended positions, the market can foster conditions for more sustainable movements, potentially leading into an accumulation phase or a consolidation period ahead of the next market shift.
Current Downtrend of XRP and Key Resistance Levels
Presently, XRP is trading within the $1.35–$1.40 zone, indicating a consolidation phase after a substantial decline witnessed earlier in 2026. Technical analysis reveals a series of lower highs and lower lows, firmly establishing a downward trend.
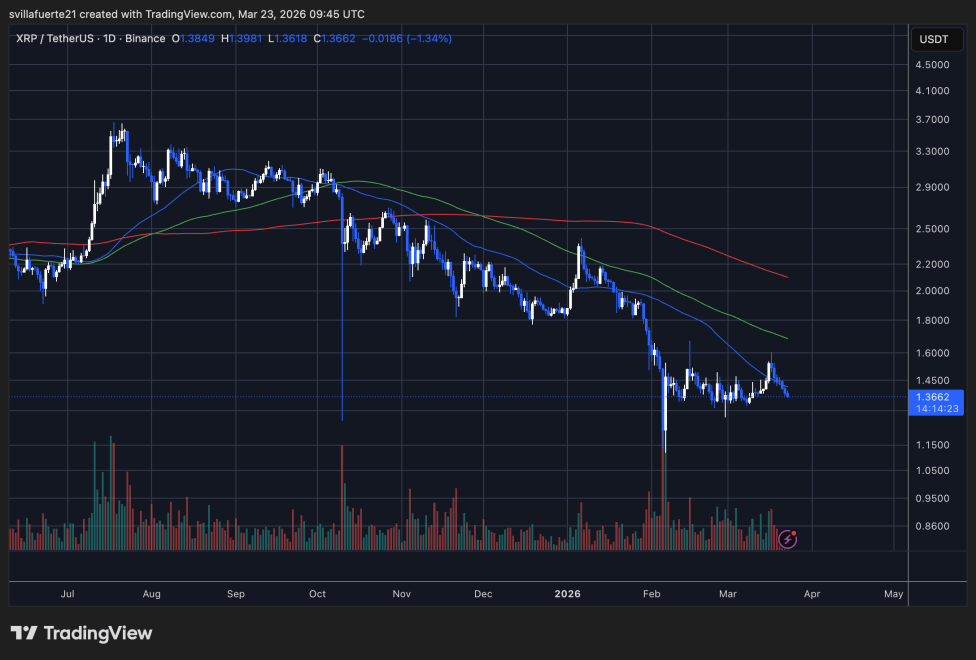
From a technical viewpoint, XRP continues to trade below key moving averages—the 50-day, 100-day, and 200-day—all showing a downward trajectory. This scenario highlights a persistent bearish sentiment, suggesting that any short-term price increases are more likely to be corrective rather than indicative of a meaningful reversal.
The recent bounce off the sub-$1.30 levels lacked the anticipated momentum. While there was a brief upward movement, resistance emerged near the short-term moving average, reflecting the ongoing selling pressure during price rallies. The heightened trading volume during February’s sharp drop suggests capitulation, while the subsequent phase of consolidation indicates a reduction in trader participation, signaling lowered demand.
Looking ahead, the $1.40 mark presents a key resistance point, with stronger resistance noted around the $1.60 threshold. Conversely, the critical support zone is located between $1.25 and $1.30. A fall below this area could escalate losses, while consistently breaking above $1.40 would signify the first signs of potential market stabilization.
Image sourced for illustrative purposes; chart analysis derives from TradingView.com.