The cryptocurrency market remains in a state of flux, with Bitcoin currently experiencing notable fluctuations after dipping below the significant $120,000 mark. This decline has led to increased selling pressure, creating an environment of uncertainty among investors. The present scenario can be classified as a consolidation phase, where Bitcoin’s price oscillates between robust resistance levels above $120K and critical support points below. Traders are closely monitoring these thresholds, especially as momentum indicators show signs of weakening following the recent price retraction from cycle highs.
Market analysts caution that if Bitcoin breaches its established support levels, particularly the current range lows, a further decline may occur. This situation could trigger anxiety among short-term holders (STH), leading to greater volatility. Historically, such breakdowns have often led to significant market movements, purging less committed investors and setting the stage for the next expansive trend.
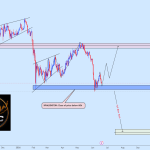
The Bitcoin HODL Structure and 30-Day Flows chart provides invaluable insights into market dynamics. data reveals the relationship between newer coins (STH) and those held long-term (LTH), indicating that the prevalence of STH has reached a stable point—an indication of consolidation. During this period, market participants appear less willing to trade their assets, reflecting a cautious approach as they await stronger signals for future price movements.
Insights from the Bitcoin HODL Structure
Leading crypto analyst Axel Adler underscores the significance of the Bitcoin HODL Structure and 30-day flows in deciphering the current trading landscape. The chart provides a visual representation of the proportion of short-term holders (STH, defined as coins held for less than six months) against the backdrop of realized capitalization, marked by the orange line, while the blue line tracks its 30-day movement.
The blue line captures net migrations in value among younger and older coins. An upward trend implies an increasing transfer from long-term holders to short-term holders, signaling potentially overheated market conditions. In contrast, a downward trend indicates the aging of coins and the emergence of resilient holders, typically seen during periods of market capitulation followed by recovery.
Currently, Bitcoin is at notable price levels, with the share of STH at 47% and the STH 30-day change at a stable zero. According to Adler, these figures point to a market equilibrium where speculative activities and heavy distributions are relatively absent. Such conditions indicate a phase where the market may be poised for stabilization, as neither bullish nor bearish forces dominate.
Historically, significant movements in the Δ above 10 percentage points (highlighted in red on the chart) have correlated with local price peaks and overheated conditions, while drops below -10 (shown in green) often signal market capitulations and subsequent recoveries. With the current Δ at a neutral position, Adler suggests that consolidation will prevail, allowing Bitcoin to settle at elevated price levels ahead of its next major move.
Monitoring Bitcoin’s Price: Essential Levels to Observe
The latest analysis of Bitcoin’s 4-hour chart has revealed heightened volatility following a rejection at the key resistance level of $123,217. After testing this zone twice in August, Bitcoin could not maintain its momentum, resulting in a swift price decline toward $115,121. The market is presently trading below essential short-term moving averages.
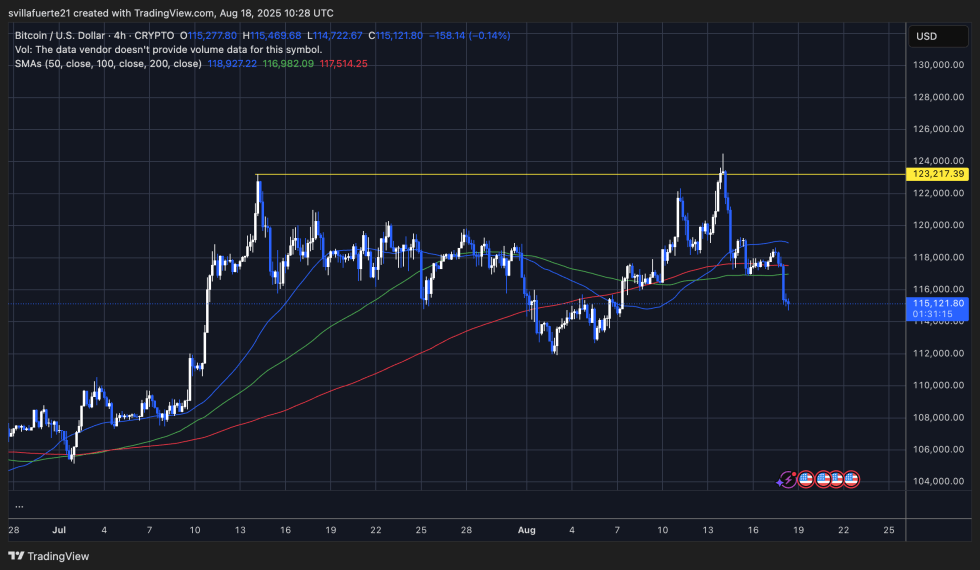
Key short-term moving averages, including the 50 SMA ($118,927) and the 100 SMA ($116,982), have emerged as resistant barriers during this period of retracement. Furthermore, the breach of the 200 SMA ($117,514) signals a loss of upward momentum, suggesting that sellers are gaining the upper hand as Bitcoin now trades below these critical averages.
The ongoing consolidation between $114K and $118K is pivotal. Should Bitcoin decisively drop below the $114K mark, potential downside targets could extend toward the $110K–$112K range, in line with past support levels and heightening the possibility of a more pronounced correction. Conversely, a strong rebound that reclaims the $118K level would signal renewed bullish sentiment, potentially inviting another test of the $123K resistance.
Image credit: Dall-E, chart sourced from TradingView