ethereum has found itself in a sea of volatility, lingering around the pivotal $2,000 mark. The latest price trends indicate a potential moment of stabilization, yet confidence amongst traders remains shaky. The $2,000 level has transformed into a crucial psychological barrier, where varying factors such as liquidity, market sentiment, and short-term strategies converge.
A recent study by a notable blockchain research firm sheds light on the dynamics of Ethereum’s supply on Binance. The analysis highlights the essential difference between liquid and illiquid supplies of ETH on the platform, categorizing the coins based on their readiness for trading. As of the latest reports, Binance holds approximately 3.57 million ETH, distributed into 1.16 million ETH available for immediate trading and a significant 2.40 million ETH that remains dormant.
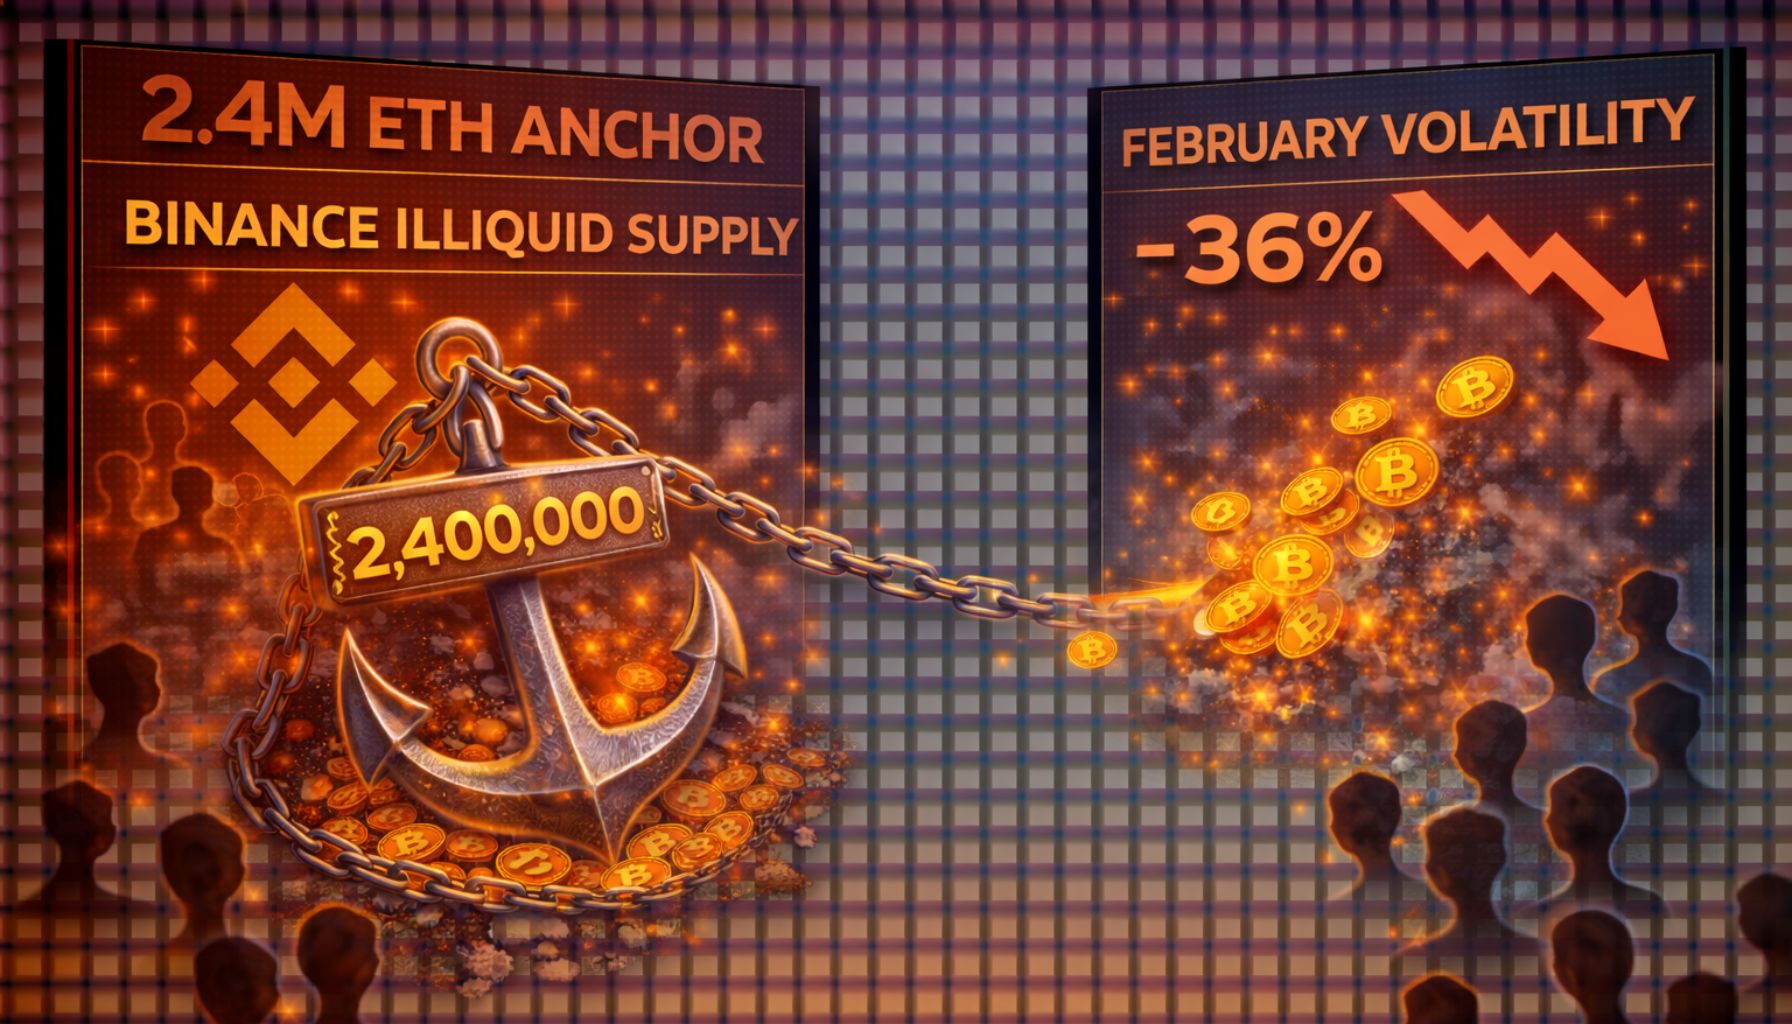
Understanding this distribution is vital. A smaller amount of liquid supply could limit immediate selling pressure but does not eliminate overall risk. Conversely, a larger illiquid supply may indicate longer-term holding strategies rather than intentions for quick sales.
As Ethereum’s price hovers at a crucial technical juncture, analyzing the composition of exchange reserves can provide insights into its potential movement.
Understanding the Dynamics of Liquid and Illiquid Supply
The current structure of reserves on Binance suggests Ethereum is balancing on a fine line rather than entering a distribution phase. With the illiquid supply representing a significant part of the total ETH held, many coins remain inactive. Typically, larger illiquid balances signal longer-term holding patterns, which can lessen immediate selling pressure.
This situation becomes particularly relevant as ETH approaches the $2,000 threshold. A high illiquid share suggests that most holders are not preparing for a quick exit. Historically, spikes in liquid supply have often preceded periods of heightened market volatility, yet such dynamics have not yet surfaced on a larger scale in the current climate.
In contrast, during speculative trading periods, liquid supply tends to increase as traders swiftly rotate their investments or prepare for market movements. The current absence of significant expansion in liquid supply indicates that speculative engagement remains low at this time.
Overall, the stable relationship between liquid and illiquid supplies points to a balance between holding patterns and active trading, although this equilibrium is contingent on market conditions. A shift towards an increase in liquid supply could trigger renewed volatility, while dominant illiquid holdings might help manage price fluctuations and mitigate rapid declines.
Ethereum’s Technical Landscape Amidst Structural Pressure
Ethereum faces considerable structural challenges as its price stabilizes near the $2,000 figure, especially following a steep decline from the $3,200–$3,400 range. A closer look at the weekly chart reveals a clear downtrend characterized by lower highs since the late-2025 peak.
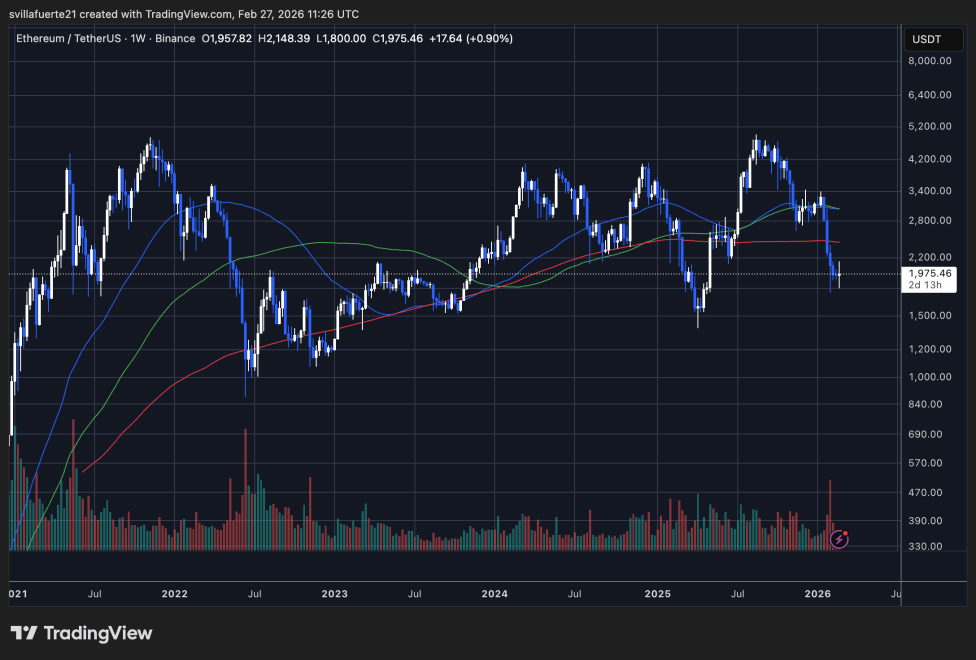
The price remains below the 50-week and 100-week moving averages, both of which appear to be flattening or trending downward. This setup is indicative of waning momentum and signals a shift into a corrective phase. Notably, Ethereum recently flirted with levels near $1,800 before experiencing a small rebound, suggesting that some demand exists within that liquidity range. However, the overall recovery has been muted without reclaiming key moving averages.
The 200-week moving average sits lower on the chart, trending upward and demonstrating that the broader macro trend is not entirely reversed. Historical data shows that this level has often acted as significant support during deeper market adjustments. If selling pressure intensifies once more, this area will warrant close attention.
Following the recent downturn, trading volume spiked, indicating forced reactions rather than orderly selling. In the days that followed, the market has stabilized somewhat, suggesting a momentary reprieve.
Image sourced from ChatGPT, chart data from TradingView.com.