Bitcoin has recently settled into a pivotal price range, as traders and investors closely examine key levels of support and resistance. Currently, Bitcoin’s price is grappling to regain footing after a dip below $80,000. This recent decline has placed the market’s focus on two critical on-chain metrics that are converging around $78,000.
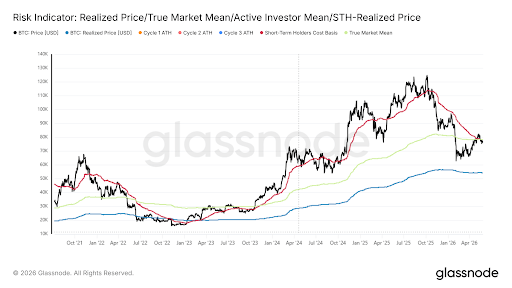
Recent data reveals that the Short-Term Holder Cost Basis, which is a key indicator of the breakeven point for newer Bitcoin investors, stands at approximately $78,000. Meanwhile, the True Market Mean, which reflects the average cost basis of actively traded Bitcoin, is hovering around $78,300. Together, these figures create a significant resistance level just above Bitcoin’s present trading range.
Bitcoin Faces Dual Pressure at Critical Price Points
At the moment, Bitcoin is caught between two market forces. On the lower end, $74,000 serves as a defensive line for buyers, while the $78,000 zone represents a strong on-chain valuation threshold. A decisive movement past either of these levels could signal whether the current price action is a short-term dip or the onset of a more significant decline below $70,000.
According to analytics from Glassnode, the Short-Term Holder Cost Basis at around $78,000 is essential to understanding market pressures on new investors. This metric indicates the average purchasing price of Bitcoin held for less than 155 days, underscoring the breakeven point for more reactive traders.
Adding to the significance of the $78,000 level is the True Market Mean, a benchmark that has historically separated bear markets from bull markets. It currently sits at approximately $78,300, closely aligning with the Short-Term Holder Cost Basis.
Support Levels Are Crucial for Recovery
Recent buyers have largely entered the market between $75,000 and $78,000, which suggests that their average cost basis is at a critical level. If demand remains strong, this could promote a recovery. Conversely, a lack of demand may lead to quick downturns.
However, spot demand has recently diminished, putting increasing pressure on the $74,000 level. Bitcoin experienced a drop to this threshold last weekend, followed by a brief rebound that was not particularly strong. Additionally, interest in US Spot Bitcoin ETFs appears to be waning, as evidenced by a significant outflow of $733.43 million in the last 24 hours.
For Bitcoin to regain upward momentum, spot demand needs to re-emerge and protect the $74,000 level. Current trends do not suggest that this is happening, as Bitcoin’s value has decreased by 3.4% over the past 24 hours, and it is trading at approximately $73,230.
The Realized Profit/Loss Ratio from Glassnode sits at 1.56, indicating a net positive capital flow since Bitcoin hit a floor around $60,000. Nonetheless, this figure remains below the 2 to 5 range typically observed during early stages of sustained bull markets.