Dogecoin has reached a significant long-term level on its monthly chart, indicating another pivotal moment for the popular meme coin, especially following a period of subdued price movements.
Crypto analyst Trader Tardigrade highlighted that Dogecoin is now at a critical resistance area where it has encountered challenges in the past. This price zone has only been approached twice over the last ten years, and each attempt has resulted in a downward trend.
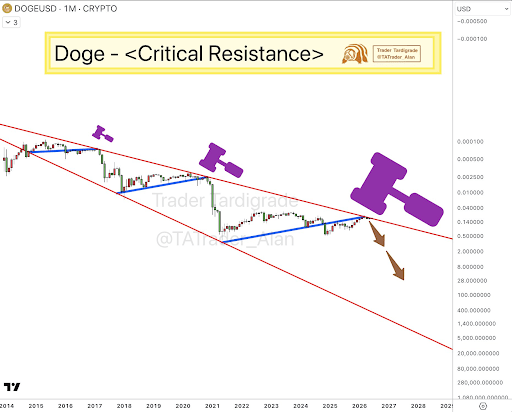
Historical Patterns of Dogecoin
According to Trader Tardigrade, a long-term analysis of Dogecoin reveals its movement within a broadly descending channel that has influenced its pricing for many years. This channel is characterized by two well-defined trendlines that progressively widen over time.
Historically, Dogecoin has rallied to the upper resistance of this channel in both 2017 and 2020, with both instances resulting in significant price retractions. Now, as of 2026, Dogecoin finds itself revisiting this position and may be on the brink of another downturn, as indicated by Trader Tardigrade’s observations.
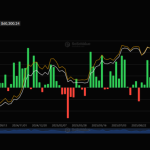
Recently, dogecoin has experienced an 8% drop in value over a three-day span, occurring shortly after it tested the aforementioned resistance area, reinforcing the notion of a potential downward trend.
Understanding the Inverted Chart Analysis
Trader Tardigrade has presented an inverted chart of DOGE/USD on a monthly timeframe. In this scenario, a downward movement on the chart indicates an actual upward movement in Dogecoin’s market price. Thus, the red line signifying critical resistance is interpreted not as a bearish barrier in the traditional sense, but rather as a bullish indicator on this inverted chart.
In both past instances, any rejection from this inverted resistance was followed by a substantial upward shift on the standard Dogecoin price chart. Consequently, the current price action could be viewed as a surge back to a support level, with expectations for a rebound in price.
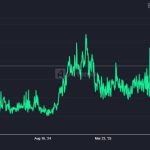
Currently, Dogecoin trades at around $0.0937, placing it within a support zone between $0.09 and $0.10. Achieving a price above $0.10 would signal a shift in market sentiment, with further gains expected if it reaches the $0.15 to $0.18 range. A breakthrough above $0.25 would provide an even stronger indication that Dogecoin is regaining momentum.
Interestingly, the inverted chart suggests possibilities for the price to reach double-digit targets before Dogecoin encounters its next major trendline.