As cryptocurrency markets face significant fluctuations, Bitcoin remains above $71,000, capturing the attention of many investors. However, beyond just the price analysis, a recent report from CryptoQuant highlights a unique scenario that has only occurred a handful of times in the last ten years.
This report pinpoints a combination of two critical on-chain metrics, painting a picture of an exceptionally favorable risk-reward balance that could reshape investor strategies. Specifically, the Short-Term Sharpe Ratio has dramatically descended into negative numbers, nearing the -40 mark.

This particular threshold is historically significant. It has been associated with prior accumulation phases in the past decade, such as in 2015, 2019, 2020, and again in 2023. Each time this level was reached, it preceded substantial re-evaluations of Bitcoin’s worth without fail.
Currently, Bitcoin finds itself in this critical area for the fifth time, reigniting discussions about market dynamics and potential future movements.
To clarify, the Sharpe Ratio serves as a tool to assess risk-adjusted performance. When it dips to -40, investors are facing enormous risks with markedly negative returns, typically leading to the exhaustion of sellers and laying the groundwork for the next significant upward movement.
Despite Bitcoin’s stability above $71,000 amidst volatility, insights from on-chain data imply a broader narrative in the market that investors should consider.
Transition Phase: A Time for Prudence
The CryptoQuant report provides further insights, indicating that durable market bottoms are processes rather than isolated events. The analysis reveals a repeatable sequence tracked by the Buy/Sell Pressure Delta.
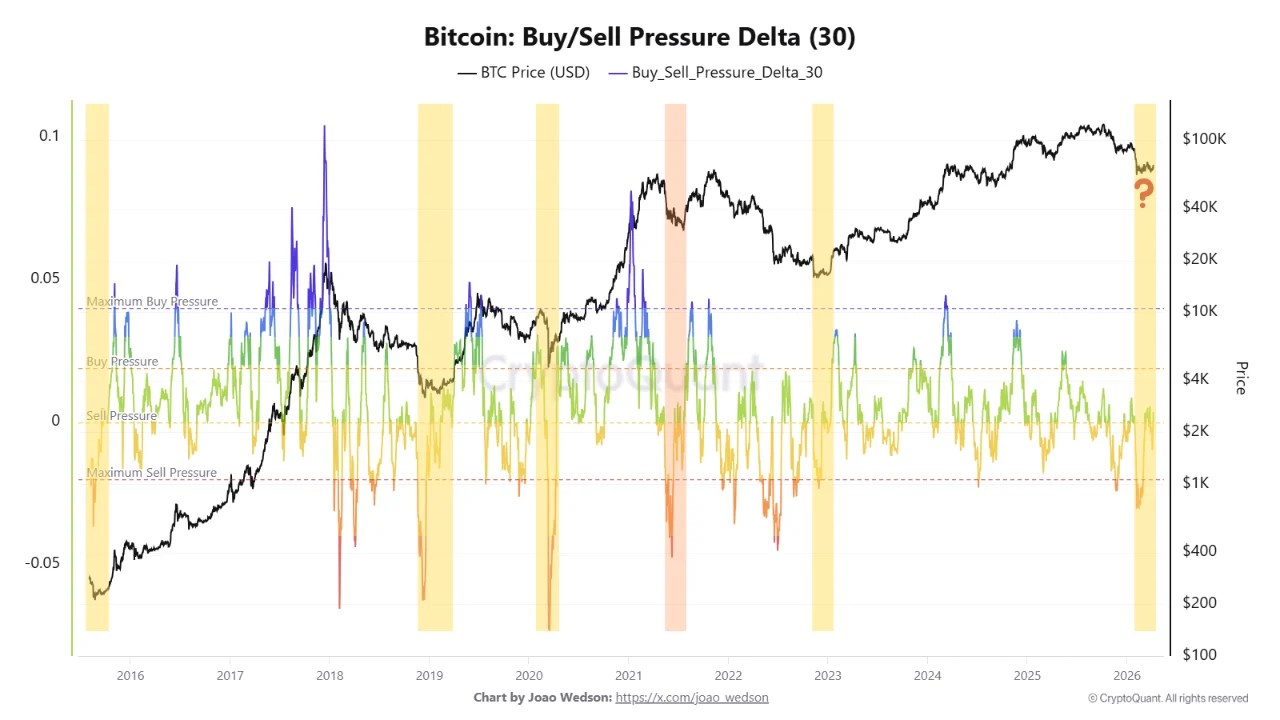
This cycle commences with pronounced sell pressure, marked by notable dips below -0.05, illustrating the moment sellers, compelled by panic, reach their limits. Confirmation of this flush phase has occurred, leading us into a period of stabilization.
What remains absent is the asymmetric signal indicating that genuine buying interest is returning. The report emphasizes that this reclaim of demand territory typically offers the highest risk-reward entry points. To repeat history, this uptick must be observed on current charts.
While we await this crucial signal, the gap between current levels and the needed thresholds is less of a red flag and more of a period of anticipation. Historically, the time between confirmed capitulation and revitalized demand has often unlocked lucrative investment opportunities.
Risks like macroeconomic challenges, liquidity restraints, and fragile market sentiment could slow this transition. Yet, data suggests that the market is more likely at the beginning of an opportunity rather than nearing its end, which is vital information for insightful investors.
Bitcoin’s Resilience Amidst Market Adjustments
The stability of Bitcoin above $70,000 follows a sharp drop that characterized early 2026. Observably, the price pattern reveals a switch from a downward trend to a more stable range, particularly between $66,000 and $72,000, with $70,000 serving as a critical pivot.
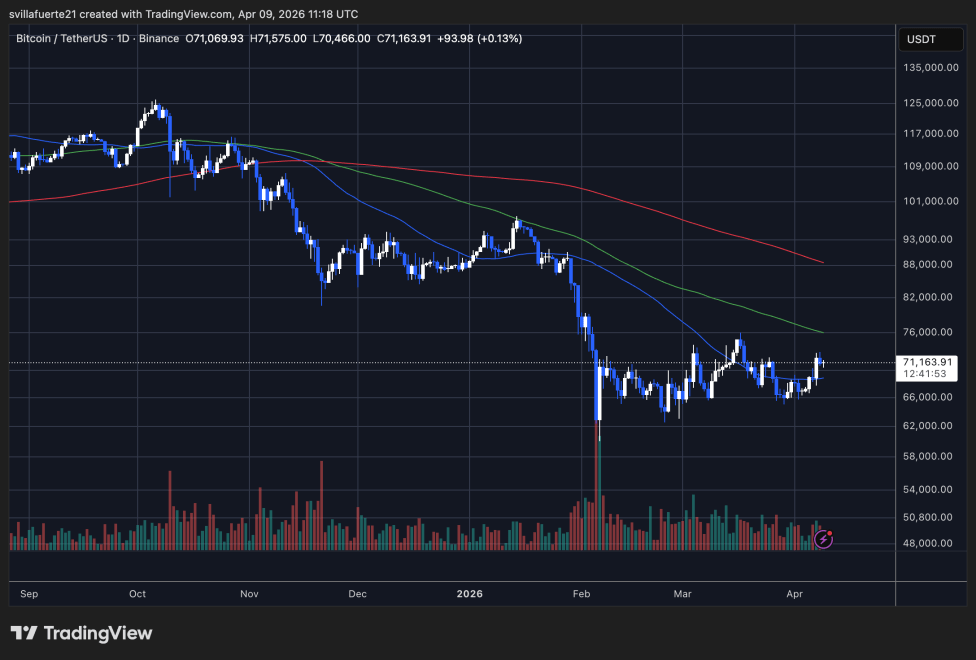
Despite this stabilization, the market’s broader trajectory appears uncertain. Bitcoin continues to remain beneath its 50-day, 100-day, and 200-day moving averages, all indicating a continued bearish sentiment. Previous attempts for price rallies have seen resistance near the 50-day average, suggesting ongoing selling pressure is present.
Volume trends provide further insights. The surge during February’s sell-off signals forced position closures, often linked to previous price bottoms. While volume has since leveled off, it hints that while the market is not under immediate distress, it has yet to enter a phase of robust accumulation.
From a structural standpoint, we are in a compression phase following deleveraging. A decisive move above the $72,000 to $75,000 range is necessary to confirm a recovery. Until that breakthrough occurs, Bitcoin’s movement will likely remain constrained, advised more by trader positioning than consistent buying power.
Insights drawn from data analysis could guide astute investors, setting the groundwork for potential future movements as the market evolves.