Bitcoin has recently encountered significant fluctuations, notably losing the $80,000 mark amid increasing selling pressure and prevailing uncertainties in the market. Analysts, including those from Rei Researcher, have highlighted this price point as a particularly sensitive area for Bitcoin, one that marks a crucial intersection of market dynamics and investor behavior.
According to Rei Researcher’s analysis, insights can be drawn from CryptoQuant’s Holder Metrics chart, shedding light on Bitcoin’s positioning in relation to various participant cost bases. This analysis reveals that the Bitcoin market is currently caught in a struggle between opposing forces, characterized by a balance of buying and selling pressures at this critical price level.
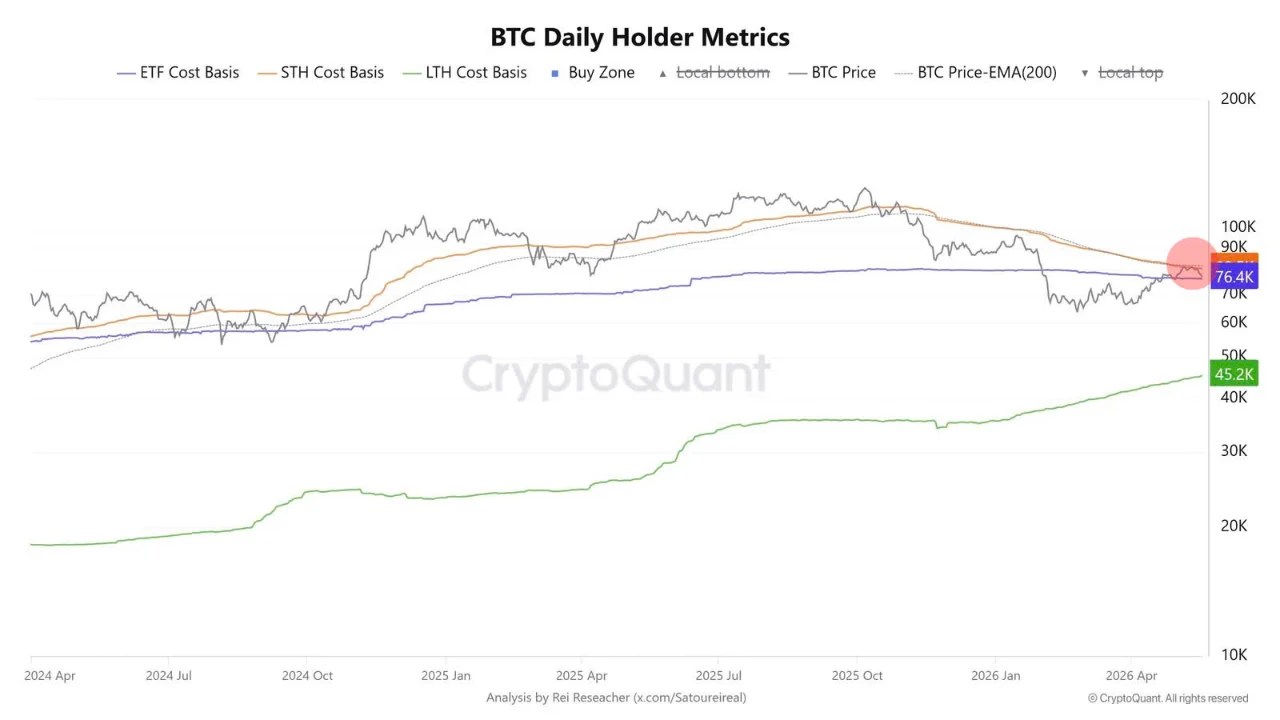
Recently, Bitcoin saw a recovery that propelled its value above the April lows, allowing a segment of short-term holders to rebound from losses. This upward move brought Bitcoin closer to the Short-Term Holder (STH) cost basis, which represents the average purchase price for individuals who acquired Bitcoin in recent months and have been experiencing losses during the downturn.
As Bitcoin approaches this STH cost basis, the dynamics within the market shift. Holders who have been waiting for a return to breakeven are presented with a decision point. Historical data suggests they often opt to sell, thereby creating a behavioral threshold that impacts market supply. Thus, the STH cost basis presents not just a technical resistance but a psychological barrier that has historically led to increased selling pressure when reached.
The Impact of Institutional Support and Selling Pressure
Rei Researcher’s findings also indicate that despite the recent decline below $80,000, Bitcoin remains above the average entry price of institutional investors, particularly those involved with Exchange-Traded Funds (ETFs). This cost basis is crucial, serving as a buffer of support in the current price environment.
Should Bitcoin fall below this institutional support level, the implications could be significant. Instituting a break might shift ETF holders from a position of profit to one of loss, which could lead to greater selling pressure and a decrease in institutional interest in Bitcoin.
The current scenario finds Bitcoin at approximately $77,000, placed within a contentious price zone. It is being supported from below by key institutional cost bases while facing resistance from the above, particularly at the STH cost basis and the 200-day moving average. The medium-term trend will not develop through slow movements but will be determined by a significant break above or below these established price bounds, accompanied by the necessary trading volume to confirm the trend.
Current Weekly Trend Shows Market Indecision
As Bitcoin trades near $76,700 on the weekly chart, it has struggled to re-establish itself in the crucial resistance zone between $78,000 and $80,000. This resistance area has become a dominant ceiling for market activity, reflecting the broader corrective trend since prices initially surpassed $110,000 late last year.
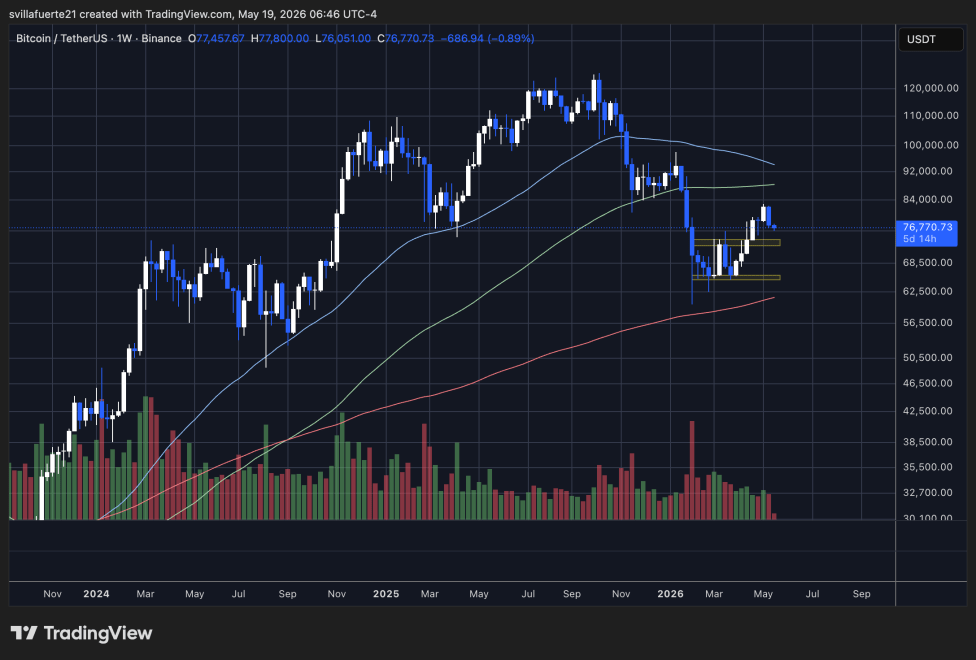
The price chart illustrates Bitcoin’s attempts to regain stability following a sharp decline that earlier pushed prices into the low-$60,000 range. There was notable buyer interest in the demand zone between $64,000 and $68,000, allowing Bitcoin to recover towards the weekly 50 moving average. However, momentum faltered as it approached resistance formed by the 50-week moving average and previous breakdown points around $80,000.
Notably, Bitcoin continues to trade below the weekly 100 moving average while the 200-day moving average lies significantly underneath current price levels. This reflects a market that still appears generally bullish on longer time frames, yet grappling with important medium-term weaknesses and uncertainties.
Trading volume during this recent rebound has also diminished, indicating a recovery phase lacking the robust demand typically seen in previous bullish movements. For the time being, the market remains confined between crucial support zones below and substantial resistance overhead. A decisive movement above the $80,000 mark could signal a return to bullish sentiment, while a drop below the $68,000 support level might usher in broader market corrections.
Overall, the evolving landscape of Bitcoin trading necessitates careful observation of these price levels and market dynamics moving forward.