Recent analyses reveal that the HODLing mentality persists among Bitcoin investors, especially with the cryptocurrency nearing its record highs.
Recent Trends in Bitcoin Holding Patterns
The latest insights from Glassnode highlight an increasing inclination for HODLing among Bitcoin enthusiasts. Two key indicators showcase this trend: Long-Term Holder Supply and Liveliness.
To start, the Long-Term Holder Supply measures the total Bitcoin held in wallets associated with long-term holders (LTHs) — those who have not moved their Bitcoin for over 155 days. Conversely, those who have held their assets for less than this duration are classified as short-term holders (STHs).
Below is a visual representation of the Bitcoin Long-Term Holder Supply’s trajectory over recent years:
As depicted in the chart, there has been a significant uptick in Bitcoin LTH Supply over the past few months, indicating that the volume controlled by long-term holders has surged.
It’s essential to highlight that this increase doesn’t imply new purchases by this group; rather, it indicates that STHs are transitioning into the LTH category by holding past the crucial 155-day mark. This trend reflects a growing commitment to HODLing within the community.
Following this ongoing evolution, the LTH Supply has recently achieved a peak of 14.7 million BTC. “This emphasizes that HODLing continues to be the prevailing strategy among investors, as accumulation trends outpace selling pressures significantly,” according to Glassnode.
Notably, the 155-day mark dates back to January, highlighting that the fresh influx of LTHs predominantly consists of investors who acquired their Bitcoin above $100,000 and were unfazed by subsequent price drops.
The second critical metric, Liveliness, also underscores a similar trend. This metric is based on the concept of ‘coin days,’ where a coin day accrues for every day a Bitcoin remains unspent.
Once a token is moved, it resets its coin days count to zero, effectively ‘destroying’ the coin days it had accumulated.
Liveliness tracks the ratio of total coin days destroyed throughout Bitcoin’s existence to the total that have been created. The following chart illustrates the movement of this indicator.
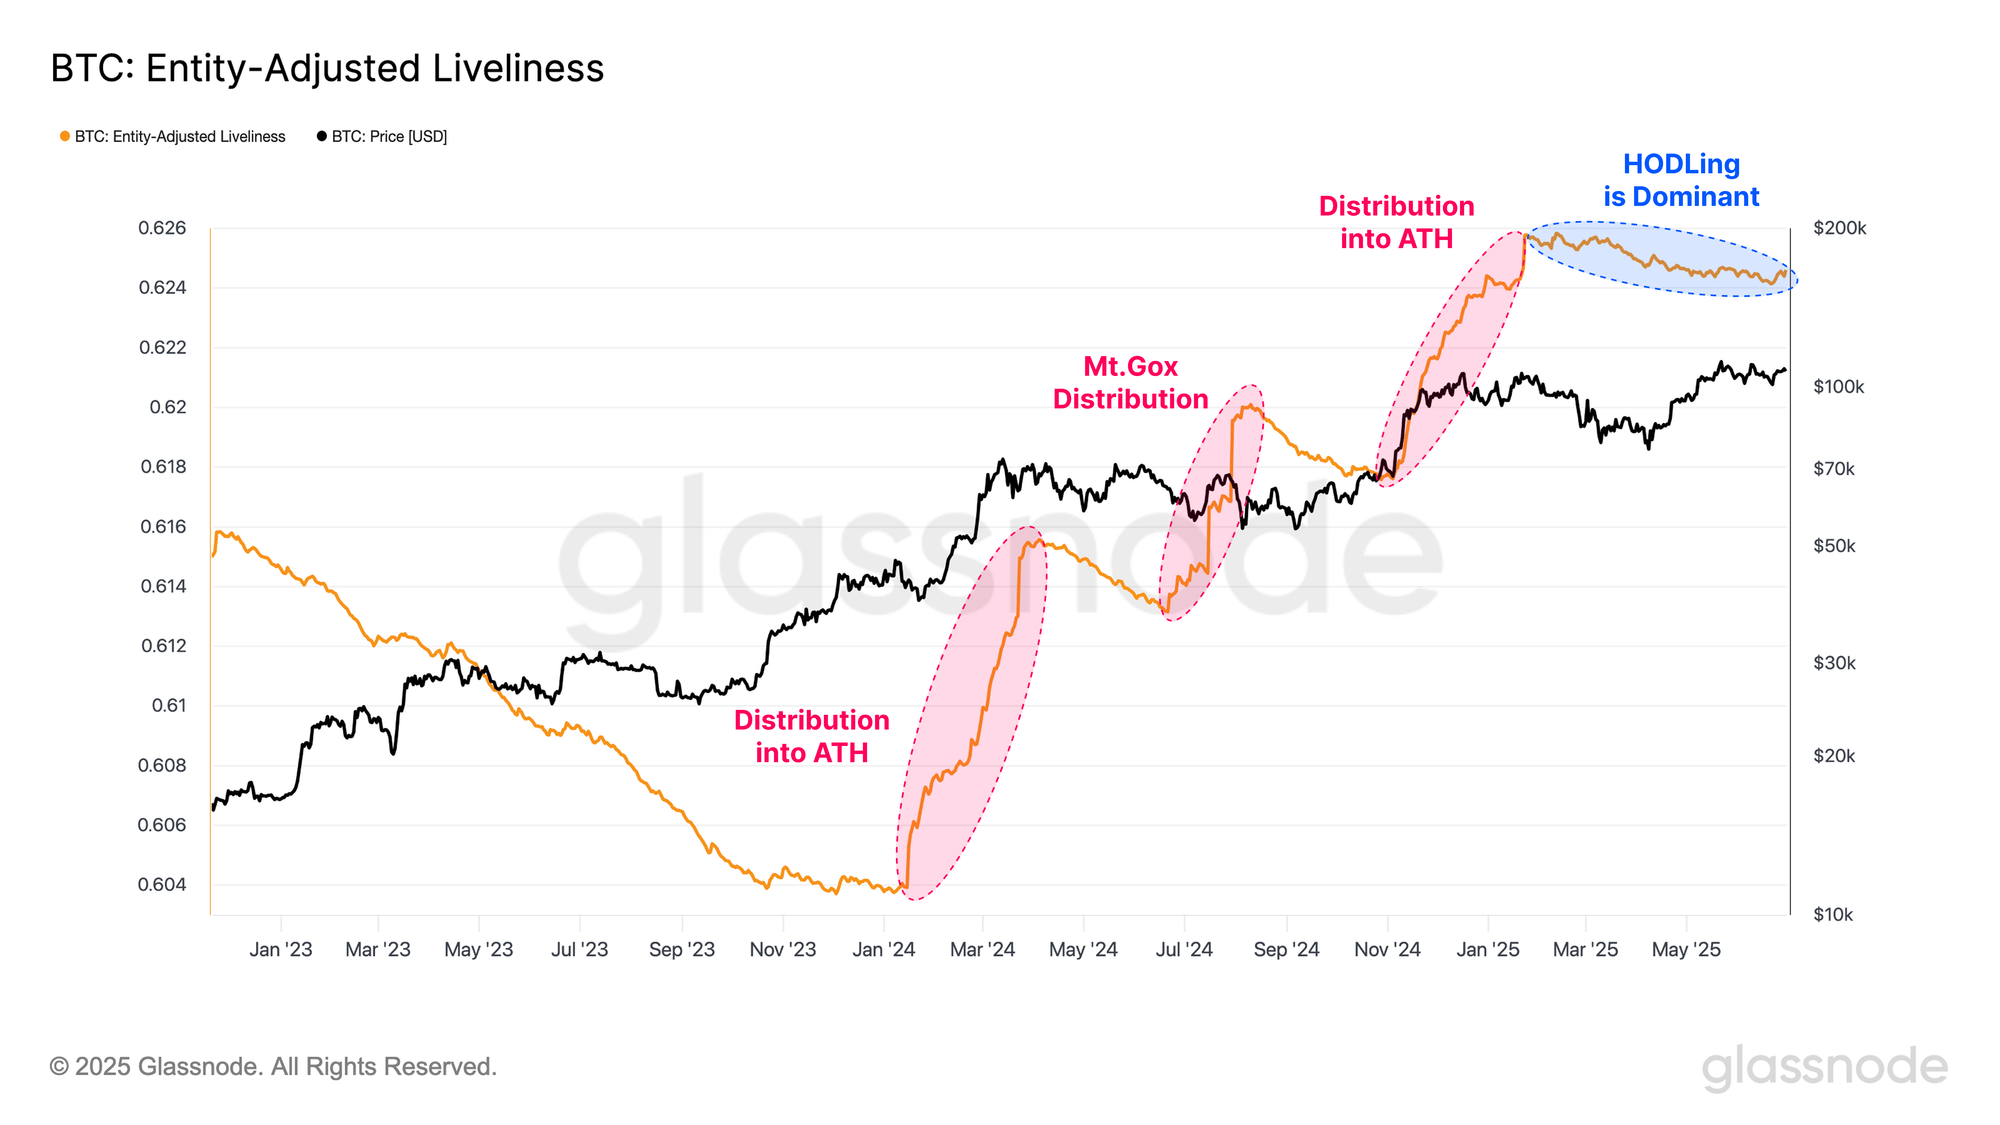
The graph indicates a rise in Liveliness during previous rallies to ATH in 2024, suggesting that HODLers engaged in selling during those periods. However, this selling pressure is conspicuously absent in the current price surge.
“This further confirms that HODLing is the dominant trend among investors, indicating that a significant price range movement may be necessary to stimulate renewed selling activities,” the analytics firm states.
Current BTC Pricing Overview
Bitcoin recently exceeded the $110,000 mark, though it has encountered a minor correction, stabilizing around $109,700.