Ethereum has recently dropped below the $1,700 mark, prompting concerns about bearish pressure and overall market uncertainty. This price level has not been approached since the previous market correction. Although the price action may seem concerning, an analytical model developed by CryptoOnchain provides a different perspective, challenging the prevailing bearish narrative.
A four-state Hidden Markov Model trained on a significant dataset of Ethereum’s on-chain information indicates that the current market condition is classified as Neutral and Accumulation. This classification comes with a high confidence level of 99.6%, coupled with an 88.7% probability that this state will continue rather than shift into a primarily bearish phase. Rather than indicating a market in distribution or capitulation, the model suggests a structure that historically has preceded recovery periods rather than further declines.
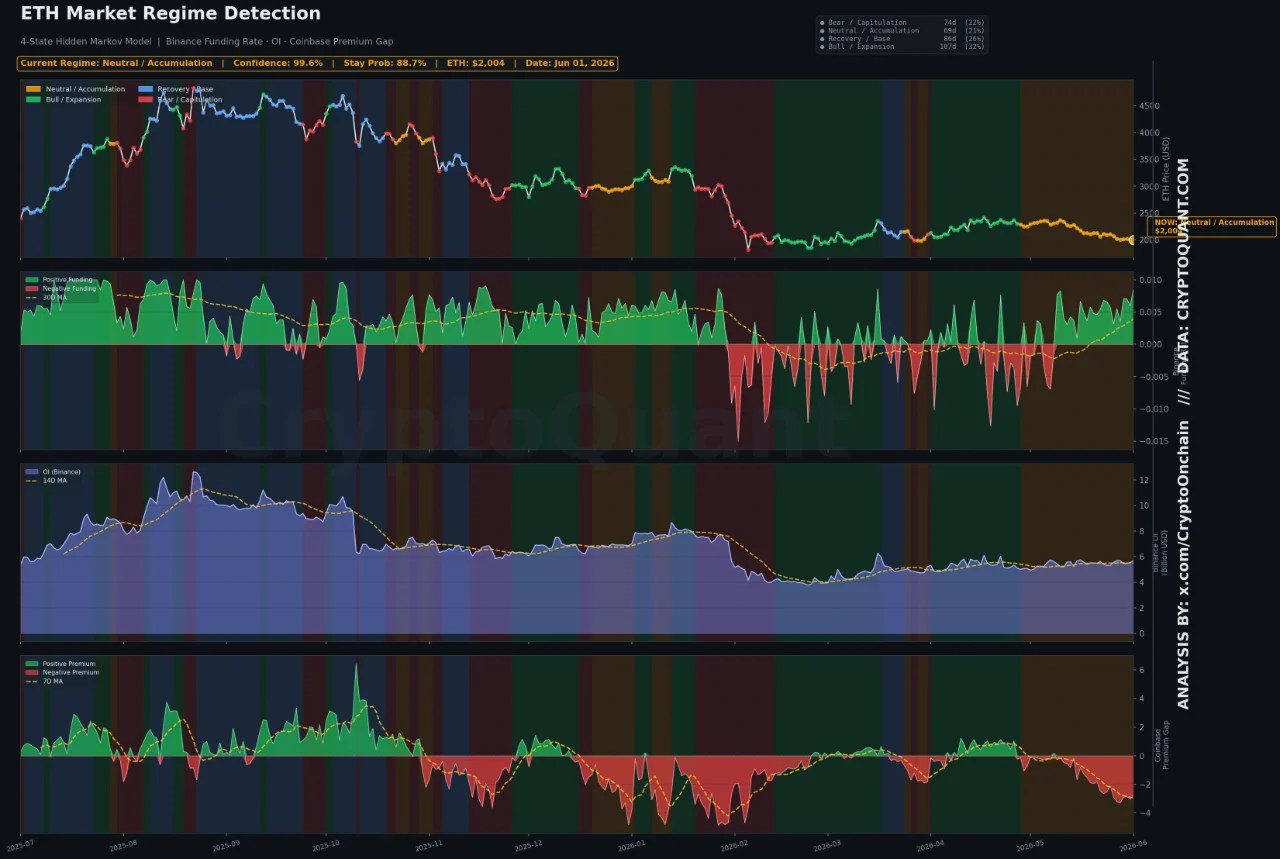
The findings from Binance metrics support this classification. Open Interest on Binance has decreased to $5.68 billion, falling below the average of $6.11 billion for this market regime. Additionally, leveraged positions are unwinding in a stable manner rather than showing signs of panic. The Funding Rate is currently at 0.0087%, indicating that neither bullish nor bearish traders are paying a premium for directional exposure.
This data reflects a market that is pausing rather than panicking, highlighting the finer distinctions that the CryptoOnchain analysis is uniquely designed to capture.
Confidence in Accumulation for Ethereum
According to a report by CryptoOnchain, one critical variable distinguishes the current accumulation phase from a potential recovery phase. The Coinbase Premium Gap currently stands at -2.73, which is notably more negative than the historical average of -1.57 during this regime. In contrast, the Recovery and Base phases that preceded previous significant uptrends generally averaged +0.99 on this metric.
The current position of the Coinbase Premium Gap indicates how much US institutional demand needs to increase before conditions for a recovery are fulfilled.
Historical context helps reinforce the credibility of these transition conditions. The last significant bullish phase for Ethereum featured lower funding rates averaging 0.0015% and modest open interest of around $6.19 billion. This suggests that the next genuine upward movement may again be driven by organic demand rather than speculative trading.
The probability of 88.7% for regime persistence indicates that the current accumulation structure is solid and not likely to change abruptly. For a transition to occur, two specific conditions must converge: the Coinbase Premium Gap needs to trend towards zero or a positive value, signaling a robust return of US spot demand, and Open Interest on Binance must increase gradually without a concurrent rise in funding rates, showing that the growth is demand-driven.
Until both conditions are met, Ethereum is likely to remain in a low-conviction accumulation phase, marked by mild structural selling pressure. The current analysis indicates that a bottom may be forming, but the necessary catalyst for a meaningful upward movement has not yet materialized.
Ethereum’s Recent Price Movements
Currently, Ethereum is experiencing significant pressure, trading around $1,670 after a loss of over 16% this week. This recent decline has pushed prices below the previous support levels of $1,800-$1,900, which had provided stability in the first half of 2026. More critically, ETH has now dipped below the February lows of $1,750, breaking a key support level that many investors viewed as the last substantial barrier before possible further drops.
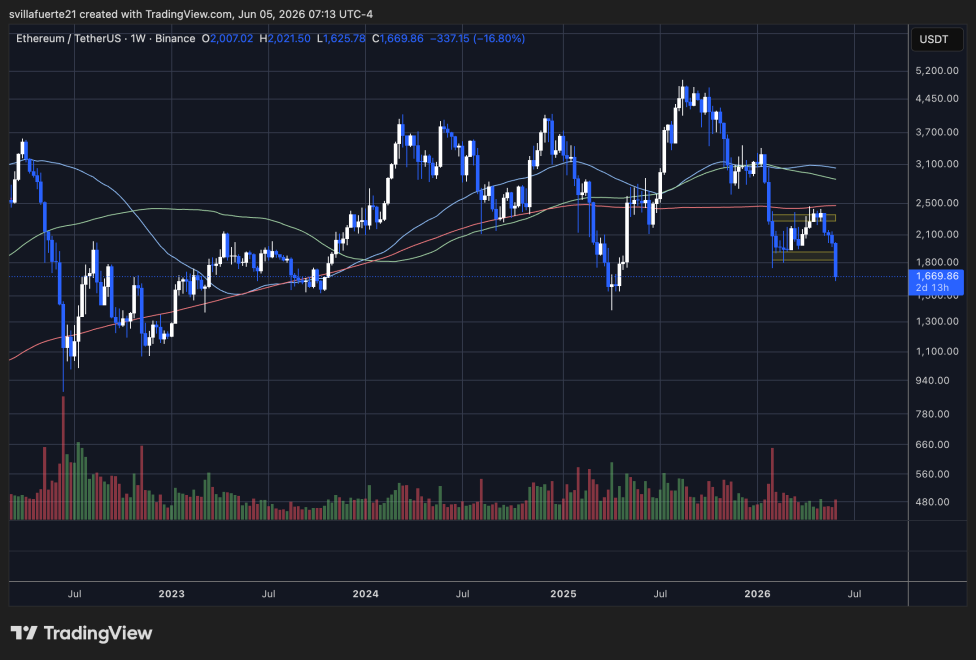
The technical outlook has noticeably weakened. The price is currently below the 50-week, 100-week, and 200-week moving averages, reinforcing a bearish trend across all significant timeframes. The rejection from the resistance zones around $2,200-$2,300 in May established a lower high, intensifying downward momentum instead of consolidating the price.
Trading volume has increased during this downward movement, indicating robust participation from traders, not a lack of buying interest. This marks the importance of the current price range around $1,600-$1,700, which now serves as the first significant support area on the chart.
Should Ethereum fail to find stability near this level, the next downside target is anticipated to be around the $1,400-$1,500 zone based on previous consolidations. For bullish investors, reclaiming the broken $1,800 level is essential for any chance of reversing the current negative trend. Without this, the weekly chart suggests a continued preference for sellers, signaled by lower highs, lower lows, and a general downward momentum.