Recent analyses from noted on-chain analytics provider, Glassnode, reveal interesting trends in Bitcoin trading behavior amidst market fluctuations. Particularly, data indicates that Bitcoin Spot Volume experienced a significant uptick during recent market downturns, only to subsequently decline.
Surging Bitcoin Spot Volume During Recent Market Dynamics
According to their latest report, Glassnode has spotlighted the fluctuations in Bitcoin Spot Volume, which gauges the total BTC actively traded on various spot exchanges.

A rise in this metric suggests a heightened level of interest and involvement from traders in the Bitcoin market. Conversely, a drop in volume can indicate decreasing investor engagement, suggesting a retreat from active trading.
Illustrated in the report is a compelling graph detailing the changes in the 7-day moving average of Bitcoin Spot Volume over the past years:
The graph indicates a significant surge in the 7-day moving average of Bitcoin Spot Volume coinciding with price declines near the $60,000 mark. This spike suggests that many traders were actively buying and selling amid the sharp price shifts.
However, the report denotes that this trading activity may not symbolize a strong resurgence of confidence among investors. Instead, the increased Spot Volume appeared to stem from panic-driven reactions to the market downturn.
From the visual data, it is evident that the initial surge in Spot Volume quickly lost momentum. This trajectory implies that, although the market turmoil captured investor attention, it did not foster extended trading interest. Glassnode highlighted that the lack of subsequent demand indicates a “shallow absorption” of the selling pressure.
Historically, Bitcoin price stability has often been correlated with consistent activity in spot trading. The recent uptick appears to reflect transient panic trading rather than a solid foundation for sustained volume growth. Glassnode remarked, “Current spot flows mirror engagement during stressful periods rather than signal a robust shift towards positive demand.”
In a related discussion, Glassnode also examined Bitcoin from the lens of the UTXO Realized Price Distribution (URPD). This unique indicator provides insight into how much Bitcoin was last purchased at varying price levels.
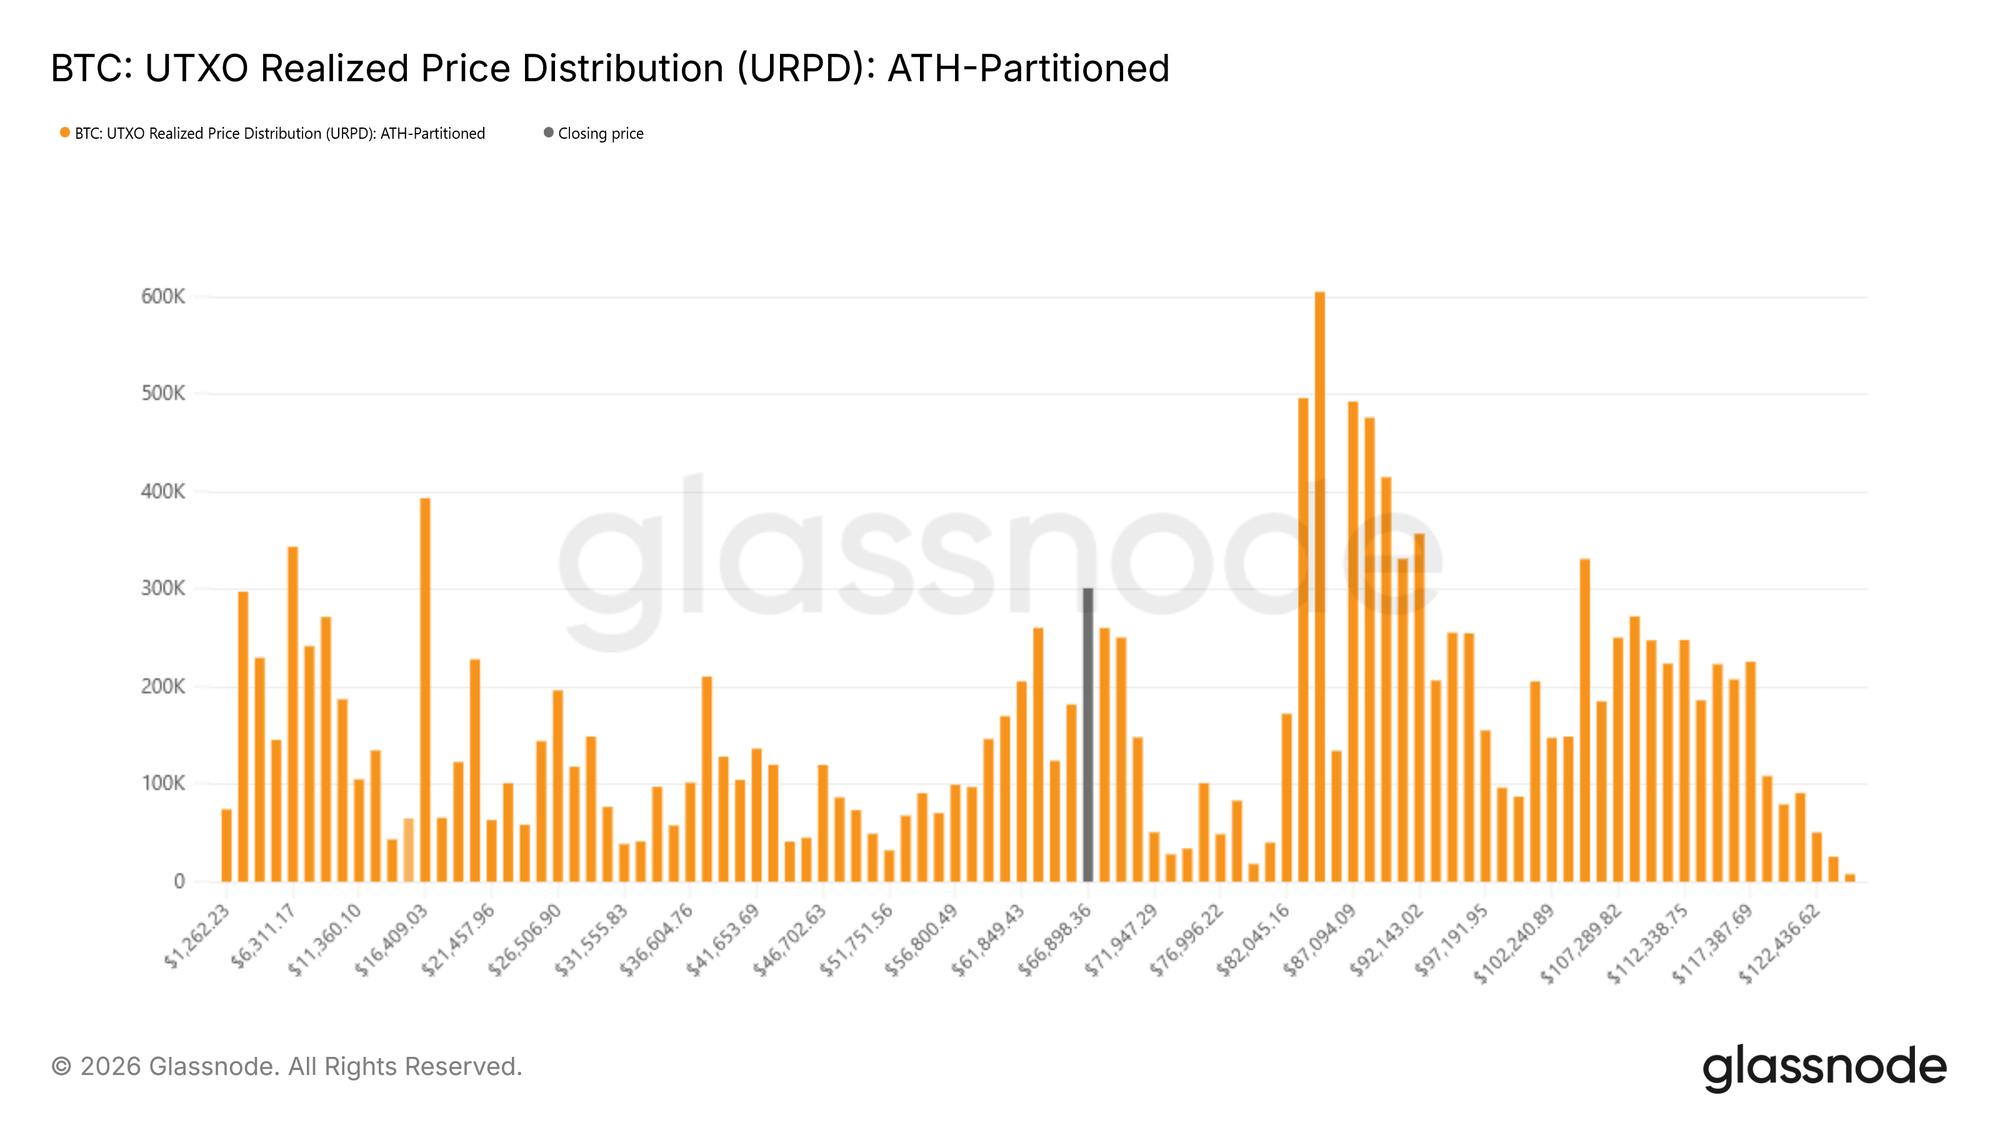
The analysis suggests that Bitcoin has found a solidified support zone between $60,000 and $72,000. This zone is indicative of prior investor accumulation. Glassnode mentions that the price stabilizing in this area may mean “previous buyers are actively protecting their positions.”
Current BTC Market Prices
As of now, Bitcoin has further dipped, landing around the $65,900 threshold, continuing a trend that reflects investor behavior and market volatility.