BONK, the meme coin from Solana, has been relatively quiet. However, new technical analysis indicates that intriguing developments may be on the horizon for its price. Recently, the meme coin has shown an increasingly positive trend, successfully regaining a crucial support level and beginning to test upper resistance.
An analyst on TradingView reveals that BONK has confirmed a double bottom pattern, suggesting potential price targets for the cryptocurrency.

Double Bottom and Golden Cross Indicating Potential Price Surge
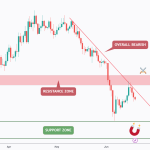
Analyzing the BONK/TetherUS pair, it’s noted that BONK has confirmed a double bottom pattern—one of the most trusted reversal signals in technical analysis. This indicates a weakening of the bearish trend that has plagued BONK since the year’s start, paving the way for a potential bullish turnaround.
BONK is currently facing a descending trendline resistance that has thwarted its attempts to rally since late December 2024. If this resistance is breached, it would signify a clear break from the prolonged downtrend.
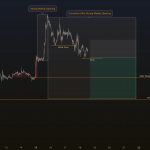
Additionally, the exponential moving averages are signaling positivity as well. The potential convergence of the 12-hour EMA-50 and EMA-200 may lead to a Golden Cross, a sign that often precedes significant price increases.
Potential Price Levels and Resistance Areas to Monitor
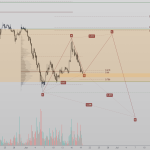
BONK appears ready to once again test the trendline resistance, this time with greater momentum. In late April, the meme coin attempted this at a price of $0.00002179 but faced rejection.
This rejection stemmed from profit-taking amidst an uptrend, originating from the second bottom at $0.00001036 on April 7. Following this, the price returned to its key support range between $0.00001550 and $0.00001425, rebounding recently.
As of now, BONK is priced at $0.00001824, reflecting an 8.3% increase in the last 24 hours. The next objective appears to be overcoming identified resistance levels as indicated by the TradingView analyst, potentially leading to a substantial price surge.
If bulls manage to breach the resistance zone between $0.00002000 and $0.00002100, the next notable resistance will be in the range of $0.00002500 to $0.00002750. This is in line with expected movement from the double bottom and can serve as a base for further consolidation. Should bullish trends persist, particularly following a confirmed Golden Cross, further attention will be on the price area between $0.00003400 and $0.00003700, which represents a critical level correlated with the 50% Fibonacci retracement from the all-time high in November 2024.