XRP has recently risen above $1.40, giving supporters a reason to believe that this cryptocurrency may be establishing a new level of support following a period of weak performance. Despite this, crypto analyst ChartNerd advises caution when interpreting this upward movement.
In a detailed analysis shared on social media, he highlighted that while there are positive signals on XRP’s weekly chart, caution is necessary as the longer-term indicators do not yet confirm a complete reversal of the recent downturn.
Evidence of Recovery in XRP’s Weekly Chart
ChartNerd’s analysis focuses on the weekly chart, where he identifies several technical indicators that typically signal important market turns. Notably, he points out the following:
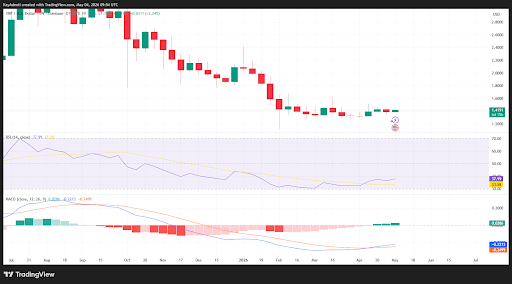
- The Relative Strength Index (RSI) for xrp has entered a historical cycle-low range.
- The Moving Average Convergence Divergence (MACD) has formed a bullish golden cross.
- The price has remained around the 200-week Exponential Moving Average (EMA).
Additionally, the monthly 50 EMA continues to act as a support level, providing further bullish indications. Each of these signals is significant as they suggest potential recovery for XRP. For example, a golden cross in the MACD is often seen as a sign that negative momentum is easing, paving the way for buyers to take control.
The relevance of these signals is heightened by the fact that XRP has been attempting to establish a solid base after undergoing a significant correction. The current support around $1.4 provides a foundation for bullish traders to operate from.
Longer Timeframes Remain Cautious
When considering XRP’s performance over a three-month timeframe, a more cautious perspective emerges, filtering out short-term fluctuations to expose the broader cycle structure.
For instance, the current three-month RSI is positioned around 54, which is noteworthy for remaining above the cycle-low point of approximately 47 observed in previous bearish phases. This suggests that a comprehensive reset of the market may still be ongoing.
ChartNerd also emphasizes the significance of the three-month MACD, which exhibits signs of exhaustion even while remaining elevated. This could potentially lead to a death cross on this timeframe. Furthermore, the three-month MACD is currently acting as overhead resistance, contrasting with the weekly MACD, which has formed a bullish golden cross.
This leads to the necessity of a balanced viewpoint. ChartNerd clarifies that he is not ruling out the possibility of XRP increasing in price during the upcoming months. However, he points out a significant risk: the recent upward movement may simply be a counter-trend rally, potentially forming a lower high before XRP experiences another downturn later in the year.
For the bullish case to become more robust, XRP must not only consolidate gains on the weekly chart but also exceed higher-timeframe resistance levels and achieve a sustainable breakout on the three-month chart.