Bitcoin is currently navigating a pivotal moment in its price trajectory, with various analysts expressing concerns about potential downturns. A recent analysis highlights a significant bearish pattern, which, if validated, could lead to a substantial price drop, estimated to be as much as $30,000 from its current position.
Understanding the Bear Flag Pattern in Bitcoin
According to recent observations by crypto analyst @0xPepesso, Bitcoin’s daily chart appears to exhibit a developing bear flag pattern. This formation arises from the price movements following a significant drop earlier this year.
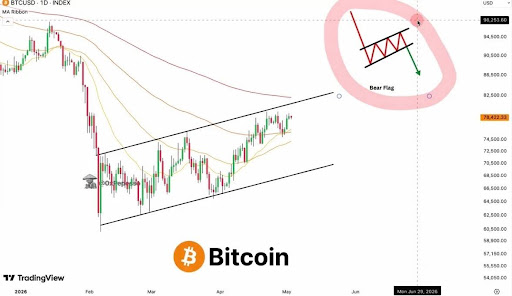
The bear flag’s structure began with a notable decline, where Bitcoin’s value plunged from approximately $98,000 to around $60,000. This steep decline forms what technical analysts categorize as the flagpole, indicative of strong downward momentum and a distinct change in market sentiment.
Following this initial drop, Bitcoin’s price entered a gradual upward-trending channel, reaching its current value of around $80,900. However, this recovery has been sluggish and indicative of a potential corrective phase rather than a full trend reversal. Price action during this period has been characterized by modest gains, typically associated with a broader downtrend.
As the bear flag continues to take shape, critical resistance levels come into focus. The price is approaching a cluster of significant moving averages, particularly the 100-day and 200-day exponential moving averages, situated around the $78,500 mark. Historically, these levels provide strong resistance during bearish phases.
The fact that Bitcoin is trading below these moving averages reinforces the bearish outlook. In technical analysis, repeated rejections at these crucial levels suggest that sellers dominate the market, while buyers are unable to regain control. The continuation of this trend raises the likelihood of further downward movement unless a definitive breakout occurs.
Potential Price Target: $50,000
If Bitcoin struggles to surpass the key moving average cluster and subsequently falls below the lower boundary of its upward channel, the bearish pattern may confirm. In such scenarios, technical norms predict a potential decline similar to the initial drop experienced earlier.
This analysis estimates a downside target within the $50,000 to $55,000 range. From a resistance point near $78,500, this signifies a potential decrease of approximately $25,000 to $30,000, reflecting the typical outcomes of bear flags that resolve in alignment with the prevailing trend.
However, there is a threshold to watch. A strong daily closing price above the 200-day moving average could disrupt this bearish condition, allowing for the possibility of upward momentum. Such a breakout might propel Bitcoin toward the $85,000 to $88,000 range.
Nevertheless, caution remains prudent, given the broader market conditions which suggest limited underlying support for sustained price increases. Unless significant changes occur in price action, the bearish scenario continues to take precedence.