Bitcoin, the leading cryptocurrency, has recently faced significant challenges, culminating in a breakdown below the crucial $69,000 mark. This decline, fueled by a mixture of selling pressure and market uncertainty, tests the resilience of a market that has retracted much of its rebound from cycle lows. Analyst MorenoDV highlights a critical signal within the supply data, providing a long-term perspective that contextualizes Bitcoin’s current situation amidst over a decade of market cycles.
Currently, Bitcoin’s Supply in Loss is at 40.6%. This means that over 40% of Bitcoin in circulation is held by those whose purchase price exceeds the current market value. This metric provides insight into market sentiment, reflecting how widespread the impact of the recent price correction has been among holders.
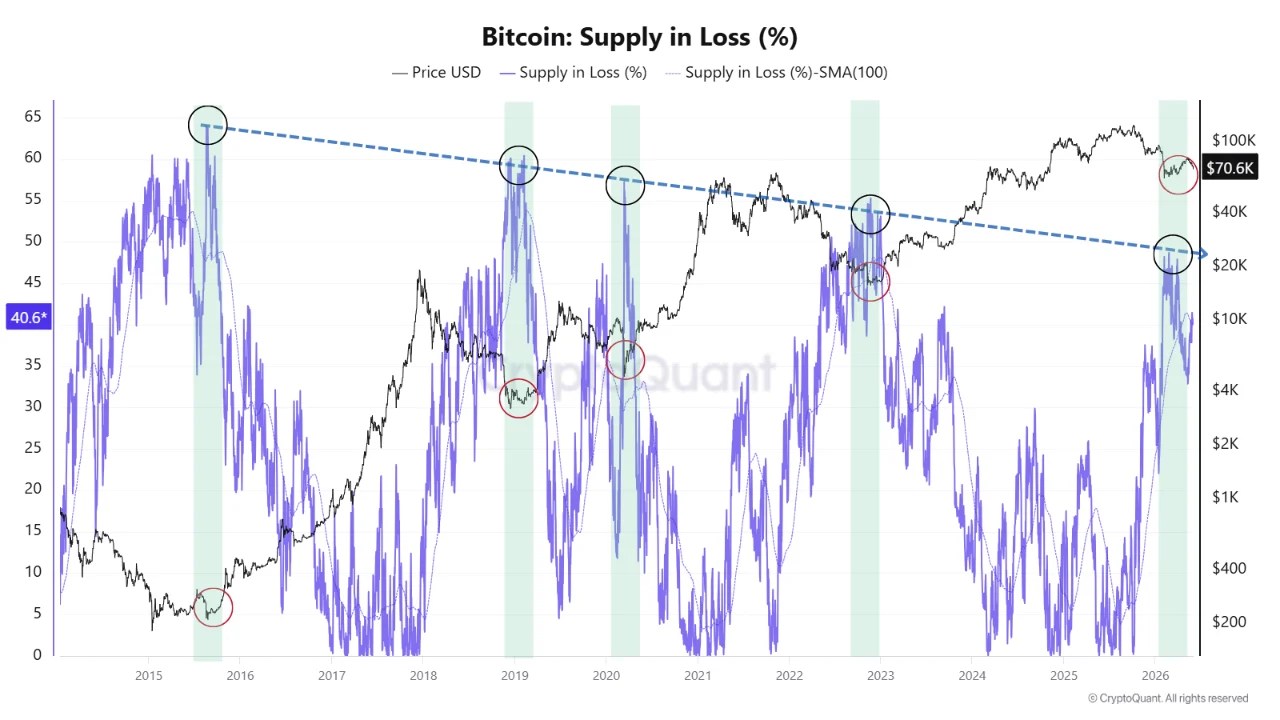
However, it is vital to note that the percentage of the supply in loss is just one aspect of the bigger picture. The overarching trend revealed by MorenoDV’s analysis illustrates that examining Bitcoin’s historical cycle bottoms offers crucial context, rather than focusing solely on present figures.
The Historical Context of Bitcoin Cycle Bottoms
The analysis by MorenoDV identifies a persistent trend over Bitcoin’s modern market history, indicating that each cycle low has occurred when the Supply in Loss has reached the upper end of a descending trendline. Notably, successive cycle bottoms have necessitated a lower percentage of supply in loss, illustrating a pattern of decreasing distress as Bitcoin’s market structure adapts and matures.
In earlier cycles, forming a bottom often required over 60% of the circulating supply to be underwater. In contrast, the cycle lows of 2018-2019 and 2020-2022 were established with significantly lower thresholds, reflective of a more resilient holder base with stronger conviction. The current trendline is now situated closer to the high-40% range, indicating a market that includes more institutional participants and long-term holders, rather than the shorter-term speculators more prevalent in earlier cycles.
This 40.6% reading signals that Bitcoin is under significant stress without yet breaching historical maximums. If weakness continues, and Supply in Loss approaches the descending trendline, it could present an opportunity for accumulation as it aligns with patterns observed over a decade.
The psychology behind these trends is crucial. An increase in supply held at a loss can shift market sentiment from optimism to skepticism, gradually leading toward a period of forced patience where reactive sellers exit the market. This transition can set the stage for long-term capital to begin absorbing supply in a meaningful way.
It is important to understand that bottoms do not form overnight. Historical patterns indicate that this region can be marked by volatility, false breakdowns, and significant emotional fluctuations before a recovery commences. However, from a risk-reward perspective, a retest of this long-established structure appears to be an important signal for Bitcoin’s future potential.
Current Market Dynamics
Bitcoin is currently trading around $69,600 after losing the essential support level between $72,000 and $75,000. This range had been crucial as both resistance and support during recent months, making its loss a significant market development.
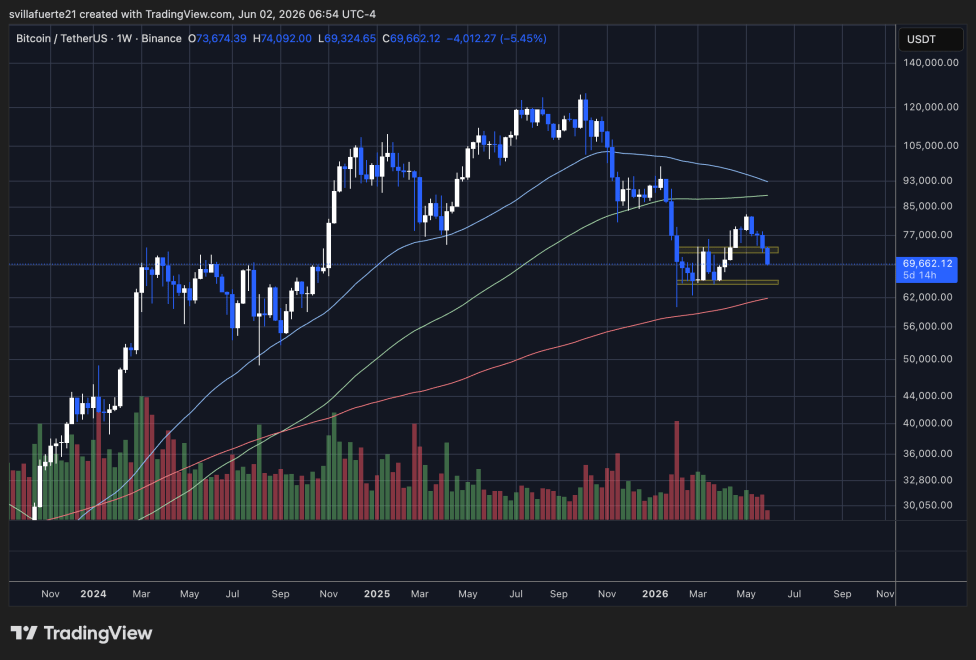
The weekly chart illustrates a reversal after failing to maintain momentum around $82,000, establishing a lower high compared to the cycle peak near $123,000. This downturn has highlighted a persistent downtrend since late 2025. More concerning for bulls is that the price has now dipped below both the 50-week and 100-week moving averages, which are currently flattening following extended weakness.
The immediate support lies between $64,000 and $66,000, representing a vital demand zone on the weekly chart, especially significant following February’s capitulation event. For Bitcoin’s price to stabilize, it is critical for bulls to reclaim the previously lost $72,000 to $75,000 range. Absent this recovery, the prevailing sentiment suggests a continued downward trajectory, placing scrutiny on whether the $64,000 to $66,000 area can serve as a reliable bottom.
Overall, while Bitcoin faces notable challenges, understanding the structural and psychological trends at play can provide context and inform future market responses.