Bitcoin has recently experienced a notable fluctuation, currently trading above $65,000 after a sharp 12% drop over a brief span of two days. This swift decline has prompted a need to reevaluate the overall health of the market, as weeks of progress seem to be unraveling. However, a new analysis from XWIN Research Japan delves into the on-chain data, unveiling insights that challenge the straightforwardly negative interpretation of the price movement observed.
The analysis posits that price trends alone do not provide a comprehensive understanding of Bitcoin’s market dynamics. Instead, the underlying on-chain data reveals signals that are not immediately visible in the price charts. Currently, several of these indicators suggest a divergence from the recent price drop.
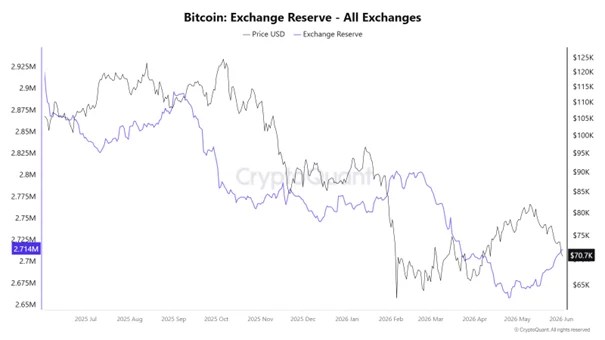
One key indicator is the decline in exchange reserves. This drop indicates that investors are transferring Bitcoin into long-term storage rather than preparing it for sale. As a result, the supply available for immediate trade is reducing, which has historically been linked to decreased sell-side pressure.
Additionally, the Stablecoin Supply Ratio offers another positive signal, revealing that considerable buying power is still waiting on the sidelines. This stablecoin capital represents potential demand that has not yet been activated but could come into play with favorable market conditions.
Analyzing Demand and Supply Dynamics
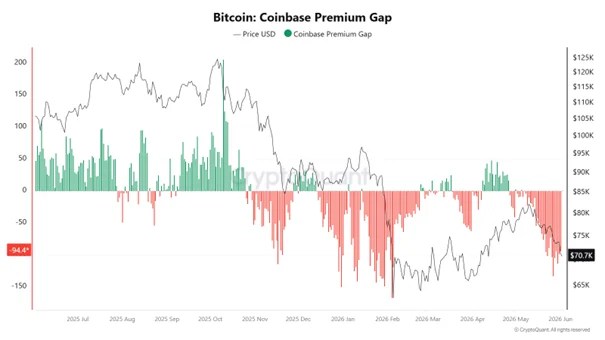
The report from XWIN Research Japan outlines an important caveat: while on-chain signals appear positive, they do not equate to an immediate recovery. The Coinbase premium index remains low, indicating a lack of robust institutional demand — traditionally a key driver of sustained price increases. While supply conditions may look favorable, it is crucial for demand to materialize to trigger any upward movement.
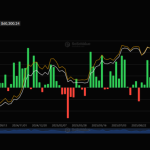
The current state of the SOPR (Spent Output Profit Ratio) hovers around neutral, suggesting a market in a holding pattern where neither profits are aggressively taken, nor losses are being realized. This situation reflects a lack of confidence among traders. Meanwhile, a cooling in Open Interest — which spiked in May — reduces liquidation risks, making the market structure cleaner for forthcoming price movements.
While the MVRV (Market Value to Realized Value) ratio is rising, it has not yet reached levels typically associated with an overheated market. This highlights growing unrealized profitability, suggesting that while conditions are improving, they may not yet be extreme enough to indicate a significant market shift.
The Weekly Bitcoin Chart: A Pivotal Moment
When examining the weekly chart for Bitcoin, it becomes evident that the market is under substantial pressure, particularly after failing to maintain support in the $72,000 range. The latest sell-off has taken Bitcoin closer to the critical support zone of $64,000-$66,000, an area that has previously drawn buyers.
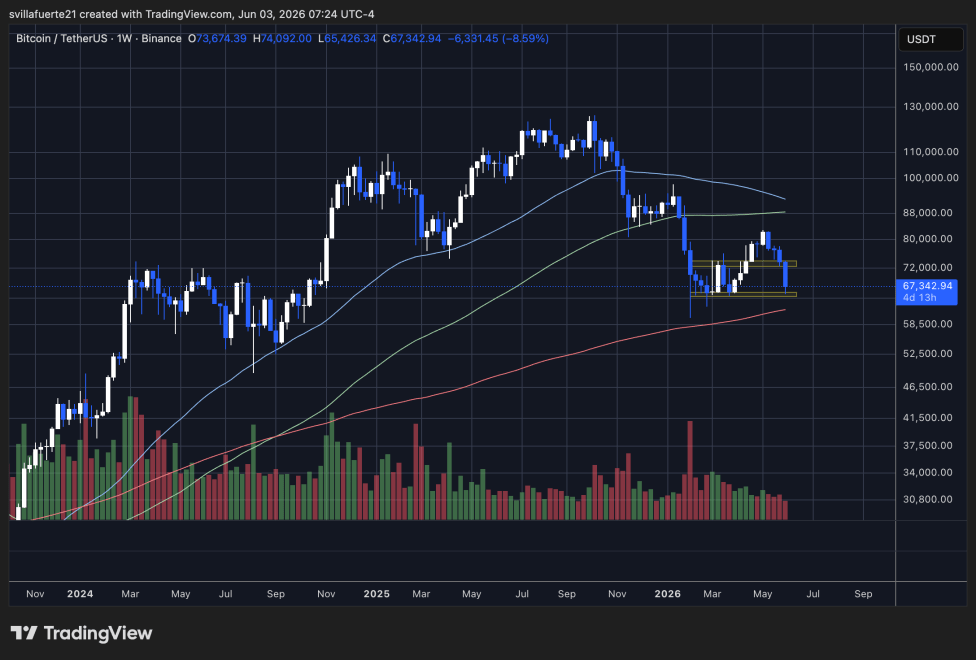
One critical technical detail is the rejection observed in the $78,000-$80,000 region, which established a lower high beneath the declining 50-week moving average. This development has reinforced a bearish trend that has been visible since Bitcoin peaked near $120,000 last year. Since that high, the market has shown a pattern of lower highs, with recovery attempts struggling to break through major resistance levels.
Despite these challenges, the current support level is crucial. The $63,000-$66,000 area has previously served as a foundation for recovery following a February bottom. Now, as Bitcoin retests this zone for the second time, its reaction could determine whether the market is establishing a higher low or gearing up for a deeper correction.
If the bulls can hold this support area and reclaim the $72,000 mark, a recovery towards the mid-$70,000s may become feasible. Conversely, failing to maintain levels above $64,000 could draw attention to the rising 200-week moving average around $62,000, potentially leading to a more significant retracement phase.
In summary, Bitcoin is navigating through a pivotal moment in its current cycle, needing to determine the balance between underlying supply conditions and the demand that is necessary to catalyze a positive shift in market momentum.