Recent analyses have highlighted the relationship between Bitcoin (BTC) and the performance of the S&P 500 index. Observers suggest that the movements in the stock market could indicate whether BTC has found its price bottom.
Bitcoin’s Price Dynamics in Relation to the S&P 500
According to crypto analyst Chain Mind, historical trends indicate that Bitcoin tends to reach its bottom only after the S&P 500 has completed its final retracement during bear markets. This pattern has been consistent in previous market cycles, specifically those of 2015, 2018, and 2022. Chain Mind asserts that the current market conditions mirror these earlier cycles, suggesting that BTC’s price trajectory is closely tied to the stock market’s performance.
As of this week, the S&P 500 achieved new all-time highs, surpassing $7,500. Despite geopolitical tensions, such as the ongoing conflict between the U.S. and Iran, the stock market remains resilient, raising concerns about Bitcoin’s potential for a bottom. Chain Mind hinted at the possibility of Bitcoin finding its low point soon if the stock market experiences a correction.
In a separate analysis, Chain Mind noted that the S&P 500 is exhibiting indicators of a market top. These indicators include:
- Broadening market patterns
- Parabolic arcs
- False breakouts
This combination has historically preceded major market tops, as observed during past economic downturns such as the Dotcom bubble and the financial crisis of 2008. Moreover, according to Chain Mind, the current financial indicators, particularly the Buffett Indicator, suggest that a market correction is likely.
Indicators of a Potential Topping Pattern for Bitcoin
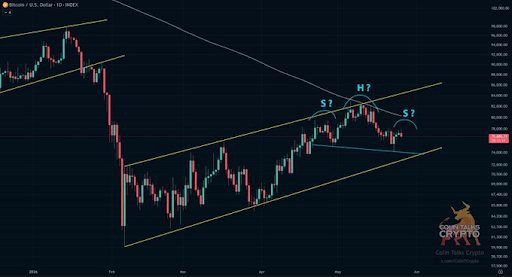
Crypto analyst Colin has also remarked on the current price movements of Bitcoin, describing them as potentially forming a Head-and-Shoulders topping pattern. This bearish indicator suggests that a breakdown below the neckline could signal further declines, with potential targets of:
- $65,000 if the pattern confirms
- $61,000 if there is a breach of the established price channel
The analyst suggests closely monitoring these price levels to gauge market sentiment.
Chain Mind reiterated his observations regarding a Head-and-Shoulders pattern emerging on the 1-week chart of Bitcoin. He noted that the price action has followed a predicted cycle, displaying peaks and subsequent declines. He anticipates that BTC may see a final bottom at approximately $50,000 based on this analysis.
For context, as of the latest market assessment, Bitcoin is trading around $75,500, reflecting a correction over the past day, according to CoinMarketCap data.
In summary, while Bitcoin continues to reflect volatility amid stock market movements, traders and analysts are advised to observe these interconnections carefully as they may elucidate forthcoming market trends.