The cryptocurrency landscape is ever-evolving, and recent insights from market analysts indicate that Bitcoin (BTC) might be gearing up for a notable price surge. The Bitcoin Rainbow Chart, a widely recognized market analysis tool, has recently signaled a buying opportunity that could hint at forthcoming bullish momentum.
Potential Buy Signals from the Bitcoin Rainbow Chart
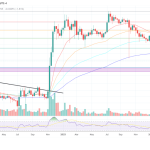
Following a recent peak on May 22, Bitcoin has been navigating a consolidation phase, oscillating between the ranges of $100,000 and $110,000. This period of relative stability does not reflect a definitive market direction. Currently, the Bitcoin Rainbow Chart indicates that BTC is nestled in the light green zone, typically associated with ‘buy’ signals.

According to crypto analyst Crypto Rover, the positioning in this ‘buy’ zone historically suggests imminent growth phases for Bitcoin. This indicator has proven valuable shortly after past halving events, making it a focal point for traders and investors alike.
For those unfamiliar, the Bitcoin Rainbow Chart employs a logarithmic scale along with color-coded bands that reflect Bitcoin’s price relative to historical data. Each color denotes different market sentiment, assisting investors in determining overvaluation and undervaluation levels.
Despite the positive cue from the Rainbow Chart, a broader outlook reveals potential concerns. Recent reports indicate that demand for BTC may be waning. Analyst Darkfost highlighted in a CryptoQuant post that underwhelming market activity has been a barrier to Bitcoin’s price advancement.
In support of this observation, Darkfost provided an analysis comparing new Bitcoin supply with coins that have been held without movement for over a year—a metric commonly used to assess market demand. A ratio exceeding zero generally points to robust demand, but recent trends suggest a decline.
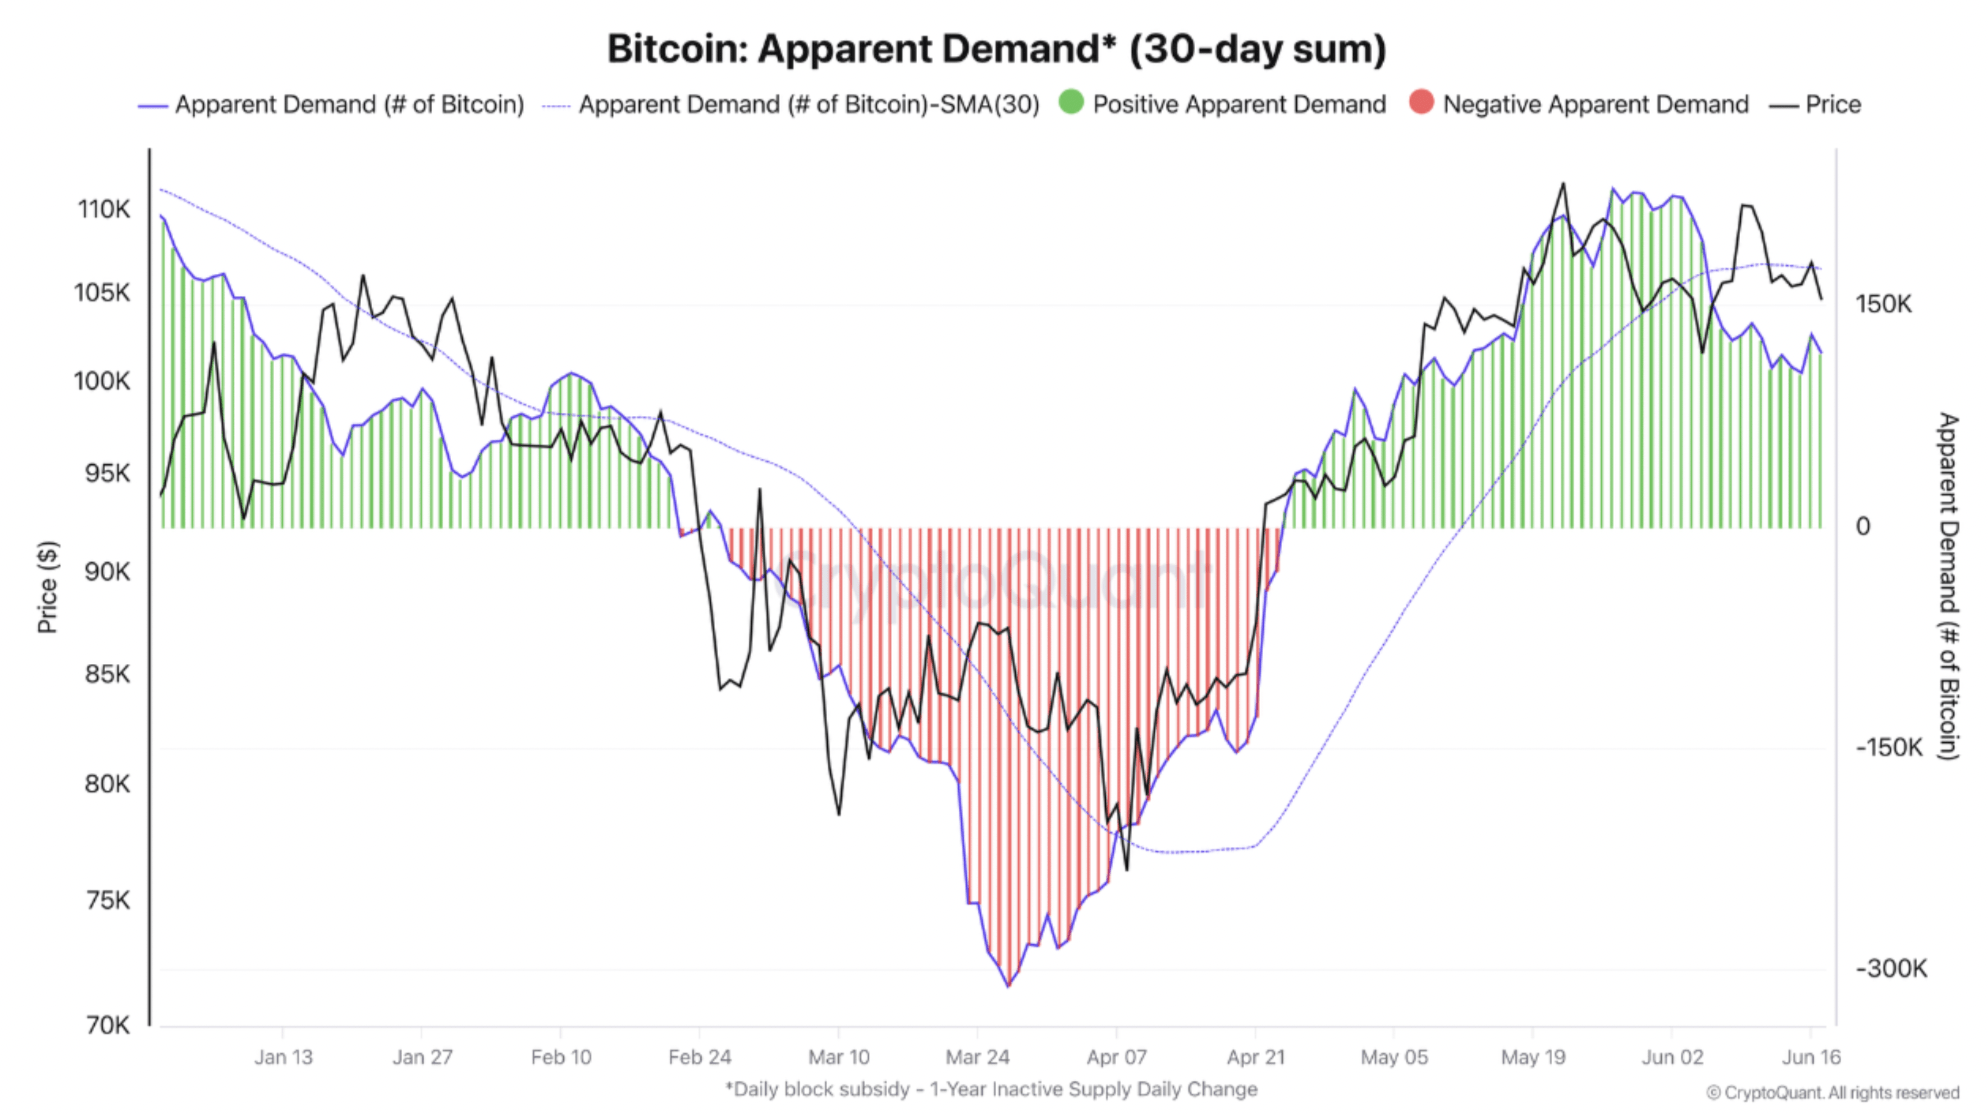
Although Bitcoin currently holds a position above $100,000, this flagging demand may signal upcoming challenges for sustained growth.
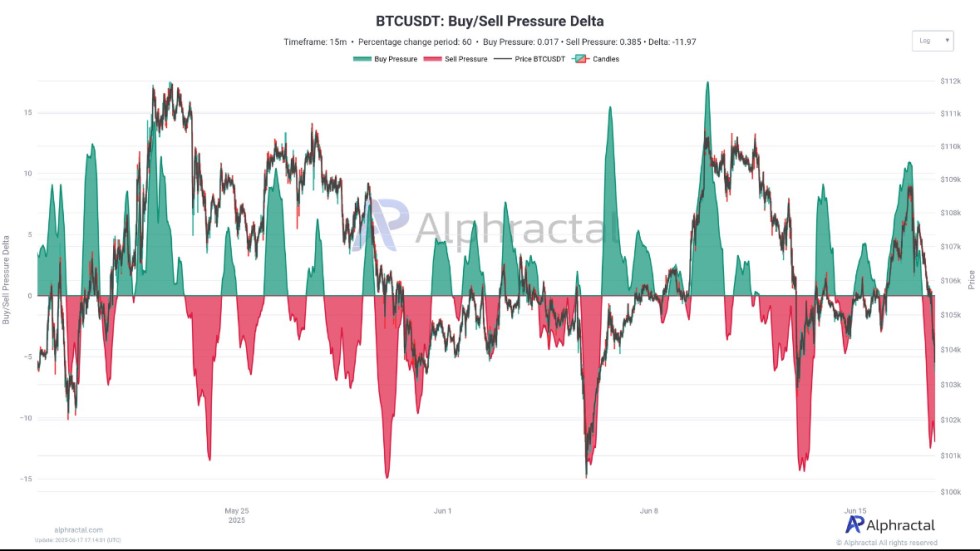
Encouragingly, not all signs are bleak. Merlijn The Trader, another prominent figure in the crypto community, noted the presence of an oversold signal in the buy/sell pressure delta, indicating that short-term selling activity might be nearing its peak.
Caution Around BTC’s Wyckoff Accumulation Phase
Market commentator Ted Pillows recently speculated that Bitcoin might be nearing the conclusion of a Wyckoff Accumulation pattern. Should Bitcoin break decisively above the $110,000 barrier, it could swiftly ascend to the $130,000 mark, according to Pillows.

In summary, Bitcoin appears to maintain a solid technical framework, with support resting at $104,000. The market has also witnessed a degree of deleveraging following the most recent US Federal Reserve meeting.
That said, exchange activities relating to Bitcoin have begun to show signs of stagnation, and retail investors seem hesitant to re-enter the market. As of now, Bitcoin is trading at approximately $104,128, reflecting a slight increase of 0.2% over the past day.