Overview
- Bitcoin’s price fluctuations have led to significant liquidation events across the cryptocurrency markets, with recent values dropping from approximately $64,000 to around $60,700.
- According to reports from CryptoReviewing, total liquidations reached about $980 million within a 24-hour period, indicating heavy trading activity.
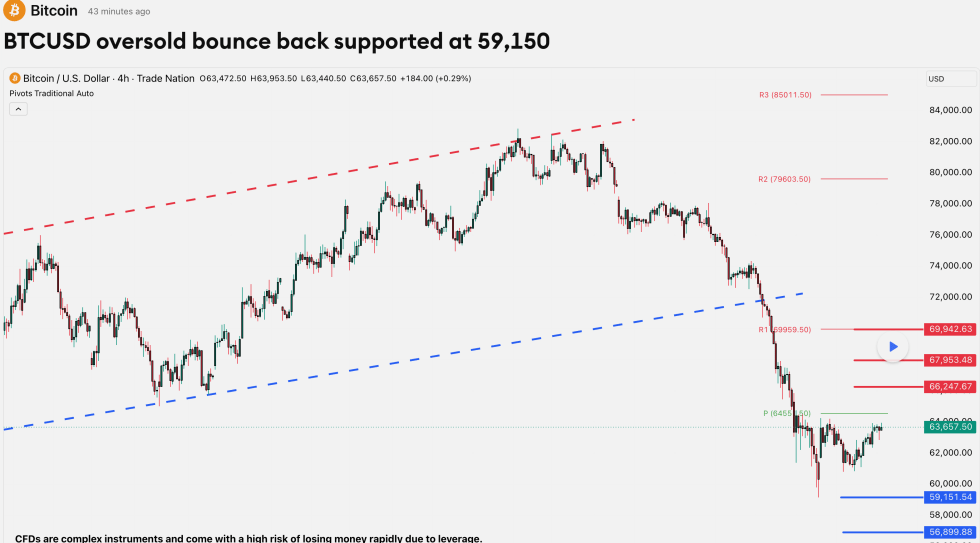
- Analysis from Trade Nation suggests key resistance for Bitcoin is at $66,247, with potential support levels situated at $59,150, $56,900, and $54,920.
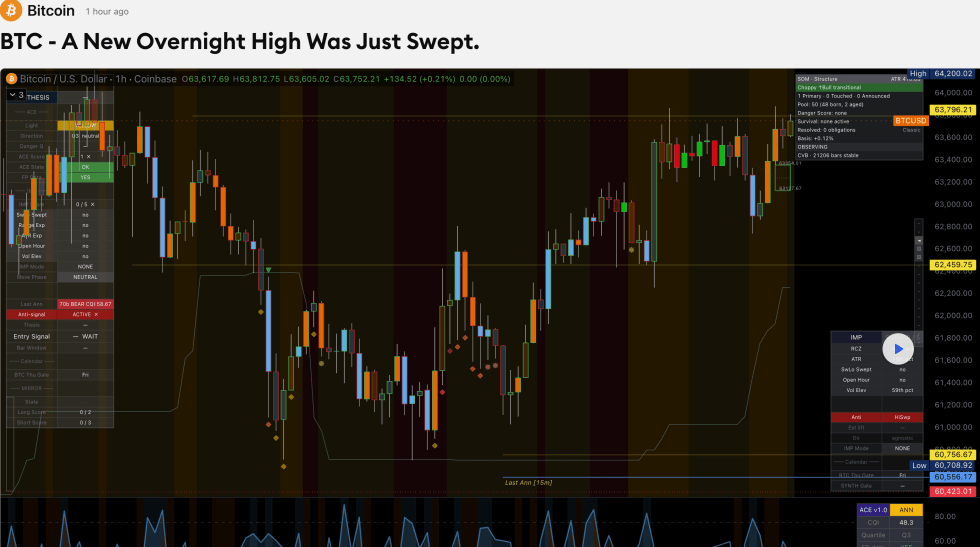
- Additional insights from TradingView indicate important levels to watch, including a “swept high” at $64,234 and a subsequent resistance at $65,890.
With these fluctuations, traders are keenly observing both liquidity zones and the relevant technical levels in order to position themselves strategically.

According to CryptoReviewing, Bitcoin first dropped from the $64,100 range to $60,700, liquidating approximately $456 million before rebounding to above $63,000 and causing an additional $524 million in liquidations. In total, this highlights around $980 million in crypto liquidations within a single day.
While terms like “manipulation” may arise in discussions about these rapid movements, the underlying issue seems to relate to high-leverage trading reacting sharply to crowded market positions. In such environments, traders on both sides risk being quickly forced out as price levels sweep through established liquidity areas.
Current Liquidity Situations
Understanding where the next liquidity pockets are crucial for navigating the current trading landscape. CryptoReviewing identified an upside zone between $63,500 and $66,000, along with a more extensive downside liquidity cluster within the range of $58,500 to $61,000.
This configuration presents a challenging situation for short-term traders. A price increase may compel short sellers to cover their positions if Bitcoin breaks into the upper liquidity zone, while a failure to maintain current levels could lead to a retreat toward the lower cluster, which may expose late-buyer positions.
It is important to note that while liquidation maps can indicate where leveraged positions are concentrated, they do not serve as definitive price forecasts. In periods of high volatility with reduced liquidity, these areas can act as attractors, often resulting in forced liquidations that can further propel market movements.
Resistance Levels and Potential Outcomes
Trade Nation’s analysis presents a structured approach to understanding Bitcoin’s current price behavior. The pivotal resistance level has been identified at $66,247 as Bitcoin navigates a corrective phase on its four-hour chart.
Should Bitcoin price stay below this level, notable support can be expected around $59,150, with additional levels at $56,900 and $54,920. Conversely, an upward movement past $66,247 would shift focus toward new resistance at $67,950 and further at $69,940.
These support and resistance levels correlate closely with the broader liquidation map. Notably, the $59,150 support aligns with the larger downside liquidity region identified earlier, while the pivotal resistance of $66,247 aligns with the upper liquidity zone between $63,500 and $66,000.
Monitoring Market Transitions
Analysis from TradingView by virDeStatera highlighted a new “swept high” at $64,234. At the time of analysis, Bitcoin was retracing to around $63,713, indicating some volatility in the price action.
Key resistance is defined at $65,890, with interim support identified in the range of $63,127 to $63,354. Should prices fall below these levels, further support can be found at $62,459, and generalized support may extend from $60,171 toward the $59,150 to $61,000 range, as indicated by liquidity studies.
The technical indicators suggest that Bitcoin must regain the $64,234 market area with solid volume before traders can consider targeting the resistance at $65,890 and approaching the wider $66,000 area.
If this critical reclaim fails, traders should shift their focus back to the lower support areas discussed earlier. Key early indicators would be around $63,127 to $63,354, followed by $62,459, and the more extensive liquidity zone between $59,150 and $61,000.
Implications for Bitcoin Traders
The current state of the market does not present a straightforward directional signal. Instead, it reveals a landscape bounded between two notable liquidity areas after substantial liquidation activity.
For bullish traders, reclaiming the $64,234 level and moving toward $65,890 would be essential steps to ultimately challenge the $66,247 resistance and the associated upper liquidity zone. Conversely, for bearish traders, failing to maintain above the low-$63,000 range would imply a return to the lower support clusters.
This dynamic highlights the importance of risk management over predictive accuracy. Given the proximity of liquidation levels to current market prices, Bitcoin can experience rapid price shifts, as was shown by the recent nearly $980 million liquidation event.
In summary, resistance levels are prevalent between $64,234, $65,890, and $66,247, while downside risks are concentrated around $63,127 to $63,354 and further through to $62,459 and $59,150 to $60,171. Until a clear break occurs in either direction, Bitcoin remains caught in a short-term volatility range.
Insights originally shared by CryptoReviewing.