XRP remains a focal point of discussion in the cryptocurrency landscape, with analysts observing various indicators and trends that could impact its future performance. Crypto expert Cryptollica emphasizes that traders might overlook critical insights that extend beyond the XRP/USD chart.
In a recent analysis shared on social media, the analyst highlights the significance of the XRP/NVIDIA ratio as an important metric, indicating how investors have largely shifted their focus towards artificial intelligence (AI) investments, while XRP and other cryptocurrencies have seen less attention. This analysis suggests that XRP might still be experiencing a prolonged period of price consolidation. The central question, however, is whether this relative weakness is approaching a pivotal change.
The XRP Long-Term Price Structure
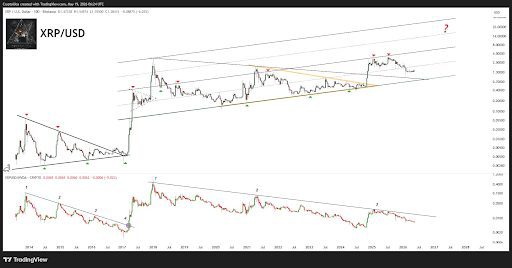
A key observation from Cryptollica’s analysis is that XRP has not yet definitively exited its long-term price structure. A chart displaying the XRP/USD pair over a span of ten days indicates a continuing upward trend that has been in place since 2017.
Importantly, XRP’s price movements appear to have replicated a pattern within this broader structure. Historical data reveals extended periods of price consolidation, followed by sharp price increases, and subsequently, additional phases of cooling. This pattern can be seen in significant price movements in 2017, 2021, and a rally anticipated in 2025, where XRP climbed above a multi-year consolidation zone before experiencing another correction.
As of now, XRP has been trading sideways between $1.6 and $1.3 since February 2026. Although market sentiment appears to be weakening, Cryptollica suggests that this is not a cause for concern. The interest in XRP goes beyond mere charting; it is essential to recognize that its long-term structure remains intact despite current market fluctuations.
Even though XRP’s price activity may be perceived as stagnant or frustrating, it does not invalidate the underlying long-term framework. The critical question is whether the support level is increasing with each cycle, which it appears to be doing.
Insights Beyond the XRP Chart
What sets Cryptollica’s analysis apart is the emphasis on the XRP/NVIDIA ratio instead of focusing solely on the USD price of XRP. This metric measures XRP’s performance against NVIDIA, a leader in the tech space, especially in the realm of AI chip production.
NVIDIA’s stock has seen remarkable growth, driven by a surge in demand for AI technology, resulting in an impressive quarterly revenue increase of 85%, reaching $81.62 billion compared to $44.01 billion from the previous year.
From the displayed chart illustrating three defined cycles, it is evident that XRP has consistently lost ground relative to NVIDIA. However, Cryptollica points out that if this trend begins to reverse, it may signal a shift in market sentiment from tech investments back toward neglected cryptocurrency assets.
While the XRP/NVIDIA ratio has not yet indicated a definitive change, it is a crucial metric to monitor. This shift, if it occurs, may suggest that the crypto market is ready for a rotation away from crowded tech sectors. Historically, significant movements in cryptocurrency often arise during periods of low confidence, making any potential increase worth observing. Currently, XRP is trading at around $1.37.