Ethereum is currently navigating through a turbulent phase marked by substantial selling pressure, reflecting a broader trend within the cryptocurrency landscape. Recent market dynamics have revealed a notable hesitancy among traders, as price stabilization efforts come up short in the face of fluctuating sentiments. The current atmosphere is characterized by elevated volatility, restricted liquidity, and ongoing macroeconomic uncertainties, which have driven both retail and institutional investors to adopt a more cautious stance, leaving Ethereum open to potential short-term declines.
A recent analysis from industry experts offers further insights through detailed on-chain data. Notably, the metric for deposits from Ethereum users to Binance has seen a sharp rise. The count of unique ETH deposit addresses has jumped significantly, climbing from approximately 360,000 to over 450,000—marking the highest figure recorded since August 2025. Such a surge in deposit addresses often indicates immediate sell-side intentions, as the assets moved to exchanges become readily available for liquidation or reallocation.
However, a spike in deposits doesn’t always equate to imminent selling pressure. It can also signify shifts in market positioning, proactive hedging, or preparations for engagement in derivative trades. Despite these possibilities, the scale of the uptick suggests increasing market apprehension, necessitating close observation as Ethereum steers through a precarious trading environment.
Rising Exchange Deposits Amid Price Contraction
The rising deposit metric coincides with a significant price decline, as Ethereum has plummeted from its October zenith near $4,900 down to the vicinity of $1,900. This correlation between a dropping price and increased exchange deposit activity warrants careful analysis, revealing two prevailing interpretations of the on-chain data.
The first interpretation hints at retail capitulation. A rapid rise in unique depositing addresses may imply that smaller investors are reacting with panic. Those who initially held their investments might be shifting assets to exchanges now in hopes of exiting their positions, intensifying short-term selling pressure.
The second scenario pertains to engagement in the derivatives market. As ETH trades below the crucial $2,000 mark, many of the new deposits could be aimed at replenishing margins for traders looking to safeguard their leveraged positions rather than liquidating their assets.
In the short term, an uptick in deposits boosts the potential for supply on exchanges, which can spark increased volatility if selling pressure materializes. Historical patterns suggest that significant spikes in deposit activity often emerge during late-stage corrections, indicating a possible seller exhaustion phase.
Observing exchange outflows, monitoring spot trading volumes, and analyzing derivatives positions will be essential in determining whether this activity signals further downside or the potential emergence of a local market low.
Ethereum Approaches Key Support Level Amid Downtrend
Ethereum is enduring continuous pressure, with its recent weekly chart reflecting a marked decline in bullish momentum after being rejected near the $4,800 to $5,000 zone. Prices have now retreated to around $1,900, an area that previously served as a consolidation support level during past cycles. The ongoing inability to maintain levels above mid-cycle moving averages indicates that sellers are maintaining structural control over the market.
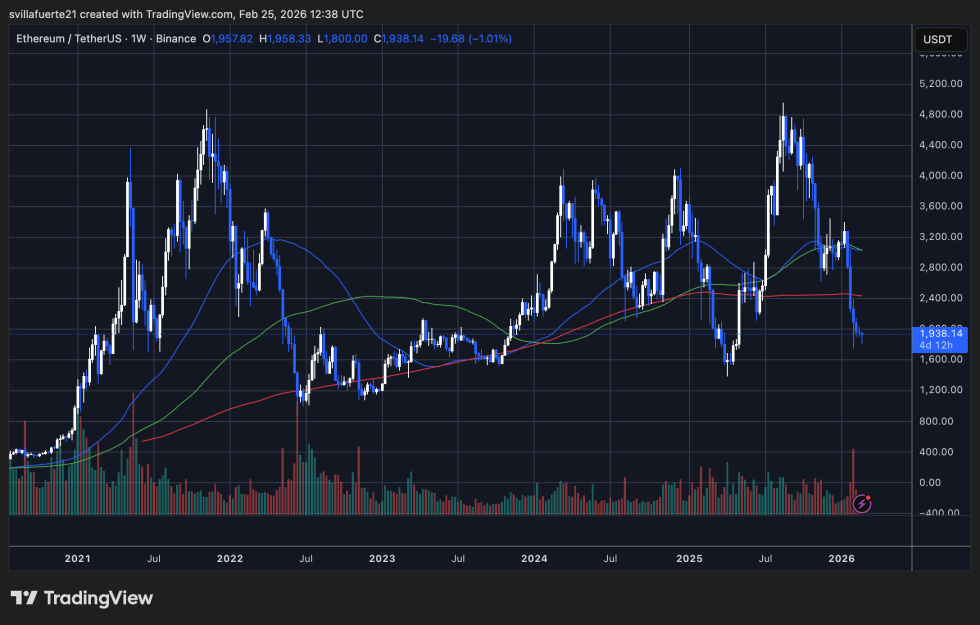
The 50-week moving average has recently rolled over, acting as resistance above, while the 100-week average appears to be stabilizing. Concurrently, prices are edging close to the longer-term 200-week moving average, which historically has been associated with crucial support points. A decisive breakdown through this area might lead to further declines, whereas stabilization might foster medium-term accumulation potential.
Volume patterns have shown intermittent increases during downturns, exemplifying distribution rather than genuine buying interest. This observation further underscores the prevailing defensive market sentiment, rather than the onset of a robust recovery.
Despite prevailing challenges, a compression in volatility near long-term averages can sometimes indicate a transitional phase. However, validation of a recovery will necessitate sustained closes above significant resistance levels and improved market participation. Until then, Ethereum continues to exist in a fragile technical landscape, with risks leaning towards further consolidation or downward movement rather than immediate bullish resurgence.
Image credit: ChatGPT, chart sourced from TradingView.com