PEPE is currently navigating its position within the meme coin market after experiencing several months of fluctuating performance. Recent chart analyses suggest the next significant movement may hinge on critical support levels. Insights shared by crypto analyst Lars Koostra on social media highlight how the meme coin is responding to a designated demand area.
PEPE’s Demand Zone and Potential for Movement
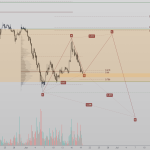
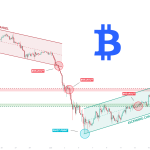
Kootstra’s analysis utilizes a TCT (Trend Change Technique) model, which he believes is now validated. The ongoing concern is whether PEPE can maintain its current demand point or whether the token is on track for a more substantial bearish trend that would push it lower.
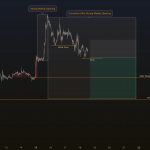
As it stands, PEPE is trading around $0.00000400, showing signs of recovery from what is identified as the primary demand point of interest. This specific area is crucial as it acts as the final line of support preventing a more significant downward movement that the TCT model anticipates.
The TCT model indicates that PEPE has displayed characteristics of distribution near the upper segments of its trading range. Earlier, the price approached a supply zone in late April but did not manage to sustain a breakthrough, reinforcing the notion that demand lies below the current trading level.
Thus, the recent upward movement should not be interpreted as a complete shift in trend; it merely postpones bearish momentum until PEPE either breaks higher with definitive strength or collapses below the current support level. As of the latest data, PEPE shows a price increase of 4.8% over the last 24 hours and 5.5% over the week.
Resisting Supply Zones: The Next Critical Test
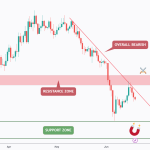
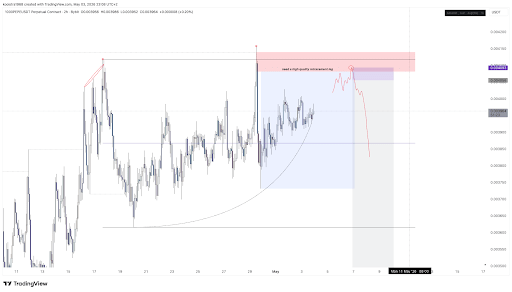
Analysis of PEPE’s trading chart shows potential movement towards a significant supply zone, with resistance appearing in the $0.000004130 to $0.000004200 range. This upper resistance area will serve as a crucial test for the meme coin’s momentum moving forward.
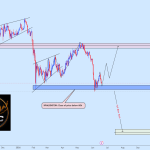
A confirmed weak response to this resistance could validate the bearish stance laid out in the TCT model while keeping targets for lower ranges—around $0.0000037—intact. Should PEPE approach this extreme supply zone, traders may consider refining their entry strategy, only increasing risk after securing high-quality confirmations of the coin’s performance.
Conversely, if PEPE breaks through this resistance level, it could signal a weakening of the established distribution pattern and prompt a reevaluation of the token’s recovery potential. Currently, PEPE is priced at $0.000004268. However, it remains down by approximately 47% over the past year, despite a noteworthy increase of over 26% in the last month. This creates a complex market environment.
The recent monthly uptick suggests a gradual influx of trader interest in PEPE. Nevertheless, the overarching trend indicates the token has yet to reclaim its previous strength. According to the TCT distribution model, a more profound liquidity movement may be necessary before any substantial recovery can occur.