View original TradingView chart
TL;DR
- Analyst fibsrus on TradingView indicates that Bitcoin may be forming an inverse head-and-shoulders pattern.
- The target is approximately $69,000 if Bitcoin successfully breaks above the neckline.
- The bullish setup will be invalidated if Bitcoin drops below the right shoulder low of about $59,400.
Potential for a Bullish Reversal in Bitcoin
A recent analysis by a TradingView user suggests a potential inverse head-and-shoulders pattern developing on the daily chart of Bitcoin. If confirmed, the target price could approach $69,000.
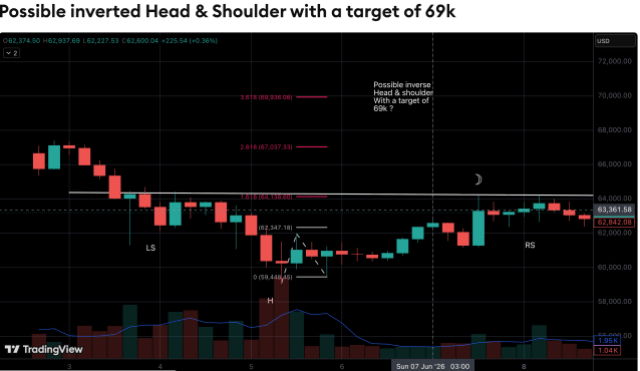
In technical analysis, this pattern consists of a left shoulder, head, and right shoulder. It is recognized as a potential reversal pattern but only after a confirmed break and close above the neckline.
The confirmation of this pattern is crucial. Until Bitcoin successfully breaches the neckline resistance, it remains a speculative setup.
Key Levels Under Observation
The analyst identifies a target of around $69,000, derived from the measured move of the pattern. This would indicate a significant recovery if Bitcoin can rise above the neckline and maintain upward momentum.
Equally important is the invalidation level. The right shoulder low around $59,400 serves as a crucial support level. Falling below this could diminish or invalidate the bullish case, suggesting that buyers have not defended a necessary support area.
Traders can use this information effectively by noting that the bullish scenario hinges on a neckline break and a sustained daily close, while the bearish case strengthens with a decline below the right shoulder.
Cautions Regarding the Pattern
While chart patterns can help in defining risk and strategy, they do not guarantee outcomes. Inverse head-and-shoulders formations can fail, particularly under conditions of low volume or unfavorable market sentiment.
False breakouts are also possible. Bitcoin may temporarily rise above the neckline, attracting buyers, only to reverse sharply if follow-through buying is insufficient. Therefore, many traders prefer to wait for confirmation via a closing daily price and, in some cases, a retest of the neckline.
Currently, the TradingView idea should be viewed more as a framework than a specific prediction. The target of $69,000 is conditional, while the $59,400 invalidation level remains critical for evaluating the bullish stance.
Source / Media Note
The chart shows a visible left shoulder, head, right shoulder, and neckline as requested.
This analysis is based on insights shared by analyst fibsrus on TradingView.
It is essential to note that the broader market context may impact the likelihood of this setup materializing. A bullish chart formation is more likely to succeed when market liquidity, risk appetite, and momentum align positively. If overall market conditions deteriorate, even a well-defined technical pattern can struggle to achieve its target. This highlights the importance of both neckline and invalidation levels over the target alone.
In summary, Bitcoin is currently positioned between a defined bullish trigger and a key invalidation area. This information is valuable not just for those who agree with the target, but also for those who may have differing views, as it delineates where the analysis is likely to hold and where it may fail.
Setup created by technical analyst fibsrus on TradingView at TradingView